ProVision 5.1.3 is a minor release with new features and bug fixes.
| Note | ||
|---|---|---|
| ||
Please note that ProVision 5.x requires php 5.5.+. For local installations, please upgrade php prior to installing the upgrade. Also ensure that the correct Sourceguardian php extension is loaded for the new version of php. |
Contact 6connect at info@6connect.com to schedule a demo or get more information.
New Features
(CFR denotes customer requested)
Customizable Dashboards:
The Dashboard Tab has undergone a major UI overhaul, and is now customizable!
The new Dashboard is comprised of modular "Widgets" that show different types of information. These Widgets may be added, moved, and edited to create personalized Dashboards. On top of this, four different column layout options are available to organize the overall Dashboard layout to suit your needs.
Dashboards (excepting the Default Dashboard) are tied to user login, and do not have dependencies or requirements - they are just HTML / Javascript - so no additional installations are required, and users may access the same dashboard between different computers or browsers. For best performance of the Dashboard, we do recommend using Chrome or Firefox browsers, however.
There are two levels of Dashboards:
Default Dashboard: The Default Dashboard is a shared dashboard for all users of the ProVision instance. It may only be edited by admin level users, but it is viewable by all users.
Individual Users' Dashboards: Additional Dashboards may be created by individual users. These dashboards are tied to the user logged in, and are only viewable / editable by that user.
Widgets:
Ten Widgets are currently available for the Dashboard. Widgets vary in purpose from static display of text elements (Markdown, Status), to highly interactive (Activity Chart, Resource Tree). Only Admin users may add or edit Widgets for the Default Dashboard; however, any user may create a personal dashboard tied to their login, and add, move, or edit Widgets for that dashboard without impacting others.
A User's permissions apply to data inside of Widgets, therefore, some users may be limited to only viewing certain data for a Widget (ie, Resource Tree).
Below is a brief overview of each available Widget:
| Expand | ||
|---|---|---|
| ||
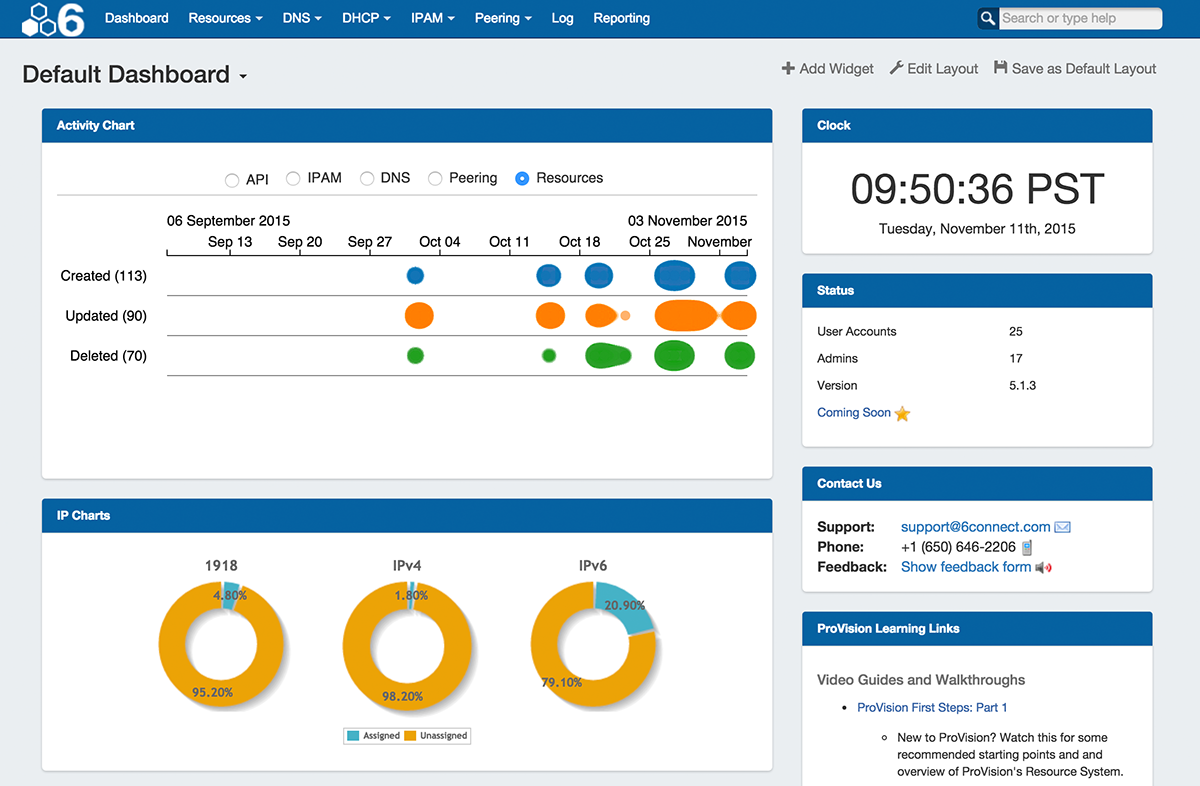
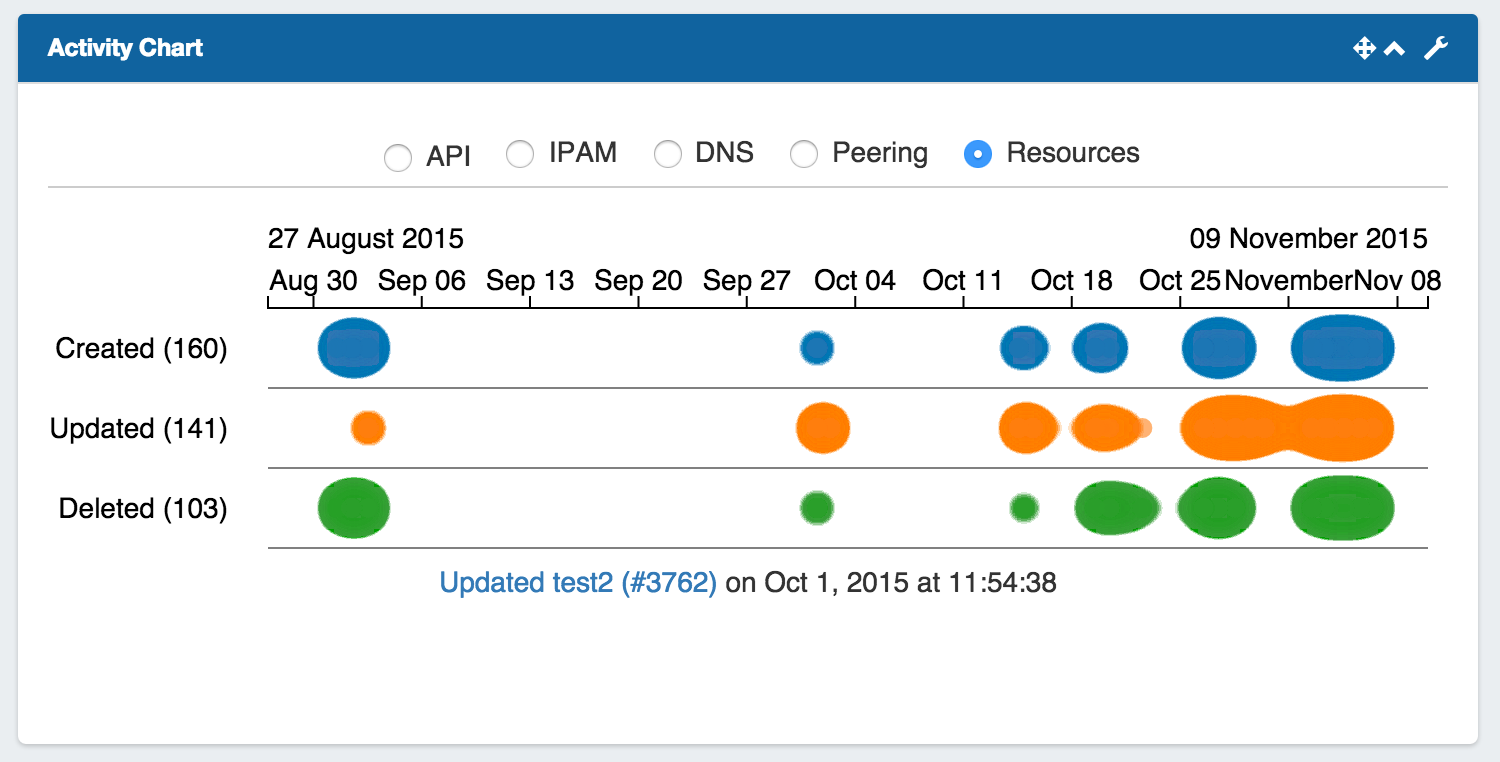
Activity Chart (Viewable by Admins Only): Illustrates activity level for API, IPAM, DNS, Peering, and Resource areas of ProVision.
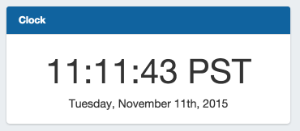
Select the desired ProVision area by clicking on the radio buttons. Then, hover over the chart, and use the mouse scroll wheel to zoom in or out of specific date / times. Clicking on a bubble will show activity detail, and resource / IP block links if applicable. Clock: Shows the current time and date for the selected time zone, based on format set by the user.
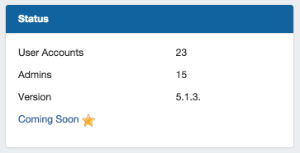
Status: General status information on number of user / admin accounts, ProVision version number, and a 'Coming Soon' link to the future releases roadmap in the the documentation.
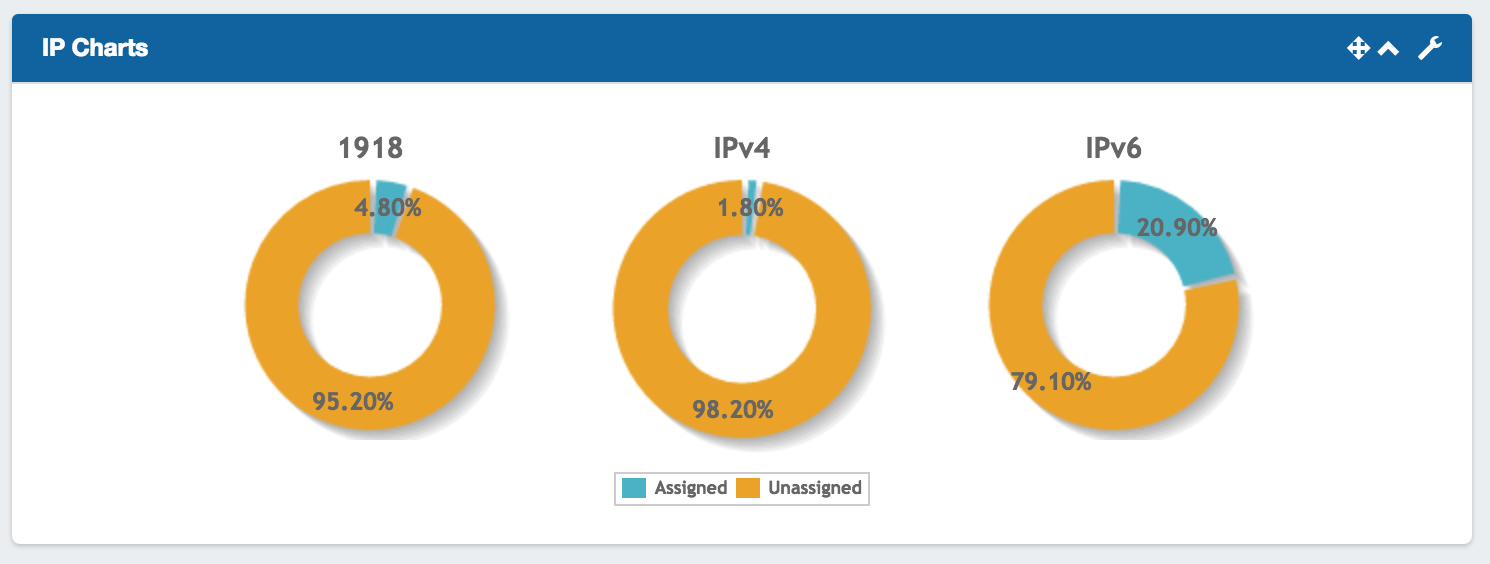
IP Charts: Illustrates the percentage of assigned vs unassigned hosts for 1918 / IPv4 / IPv6 space out of the total available hosts in ProVision viewable by the user.
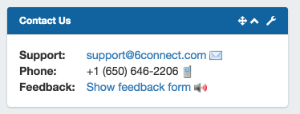
Contact Us: Provides support email, phone, and feedback form information.
Support phone number and email address are set from the ProVision Admin settings. The feedback form email address is editable within the Widget. Markdown Widget: The Markdown Widget is a blank slate where users may add links, text, or other content through use of the Markdown language.
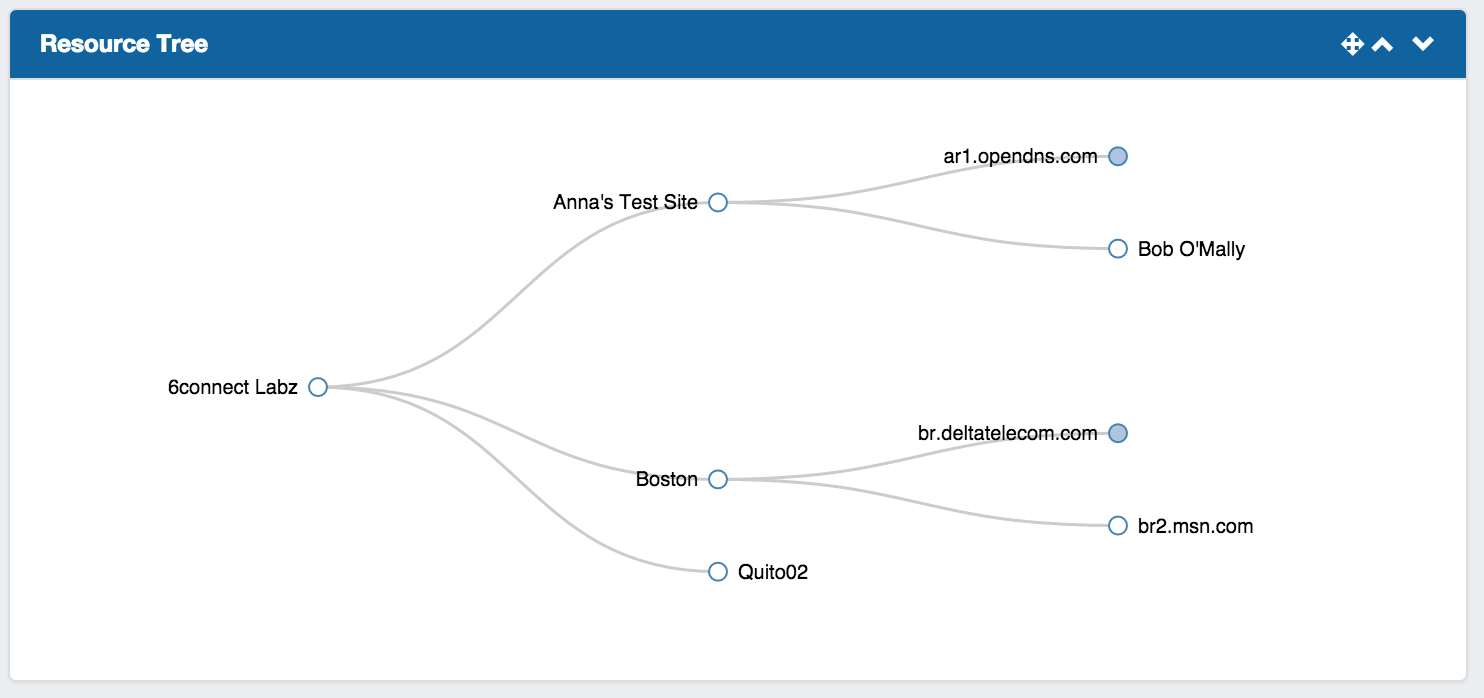
Resource Tree: An interactive horizontal or vertical treeview of a selected Resource and its children.
Users may click and drag to move within the Widget, as well as zoom in and out using a scroll wheel. Clicking on filled dots will expand the tree to show the children of that resource. Double-clicking on a resource in the tree will give you the option to navigate to the resource's entry page. iFrame Widget: The iFrame Widget sets a https URL to be viewed in an iFrame, to view stats or commonly referenced websites.
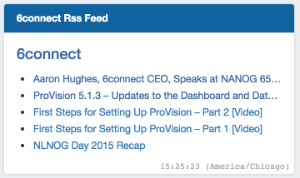
RSS Feed Widget: Shows the most recent five entries of a selected https RSS Feed. Feed links open in a new window when clicked.
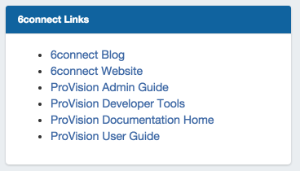
Links Widget: Shows a list of links. Link URL and display may be set from within the Widget.
|
For more details on the Default Dashboard, editing dashboards, and working with individual Widgets, see:
Resource Cloning / Template:
Cloning an Entry duplicates the Entry and, if desired, any Child Entries existing under it.
This feature can be used to quickly and efficiently create multiple resources with same format, field information, or similar hierarchy structure. See Working with Entries for additional information.
Information Cloned: Format of the original Resource (which gadgets are enabled, location, fields), contact / tech information, field information, and (if selected) Child Entries, and Child Entry sections, fields, and field informaiton - in general, items that are chosen or input at the entry creation, or input into text fields.
Information not Cloned: IP Blocks, DNS Zones, uploaded documents - in general, items that are assigned to the entry rather than input into fields.
| Expand |
|---|
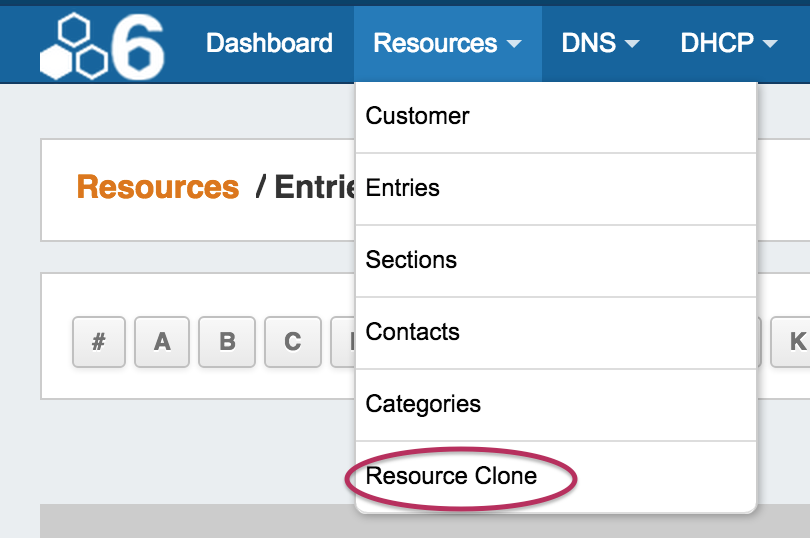
To Clone a Resource: The Resource Clone feature may be accessed from either the Resources Tab dropdown menu, or from a Resource Entry page. From the Resources Tab dropdown, select "Resource Clone". This will take you to the Resource Clone page.
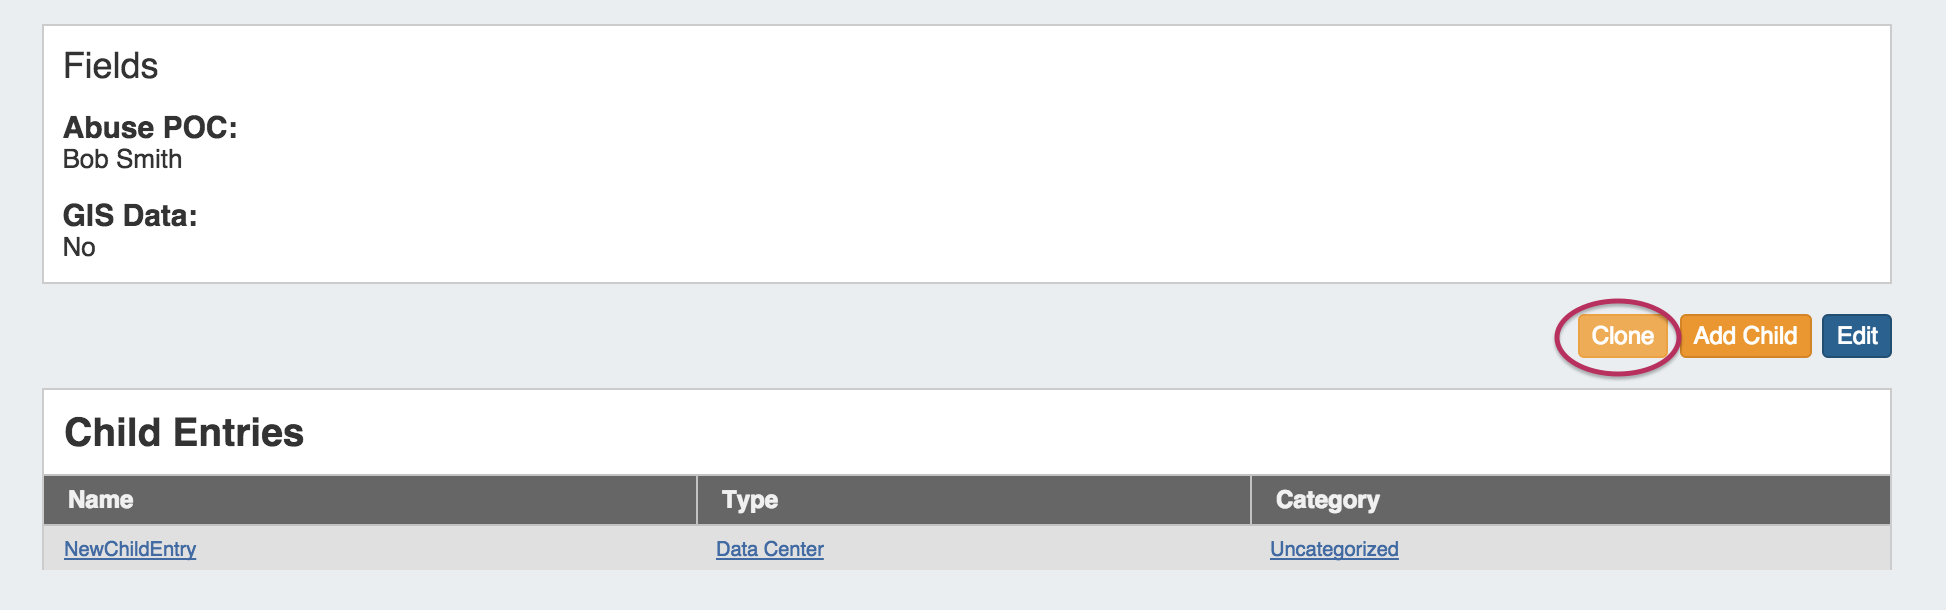
You may also select "Clone" from the bottom of a Resource Entry page, in which case the Entry page you clicked "Clone" from will be automatically selected as the resource to clone.
Once on the Resource Clone Page, enter the Resource to clone, Parent Resource, and the New Name for the clone. If you wish for all children of that resource (and their children, if applicable) to be cloned, check the "Clone Resource Children" checkbox. When complete, click the "Clone Resource" button. 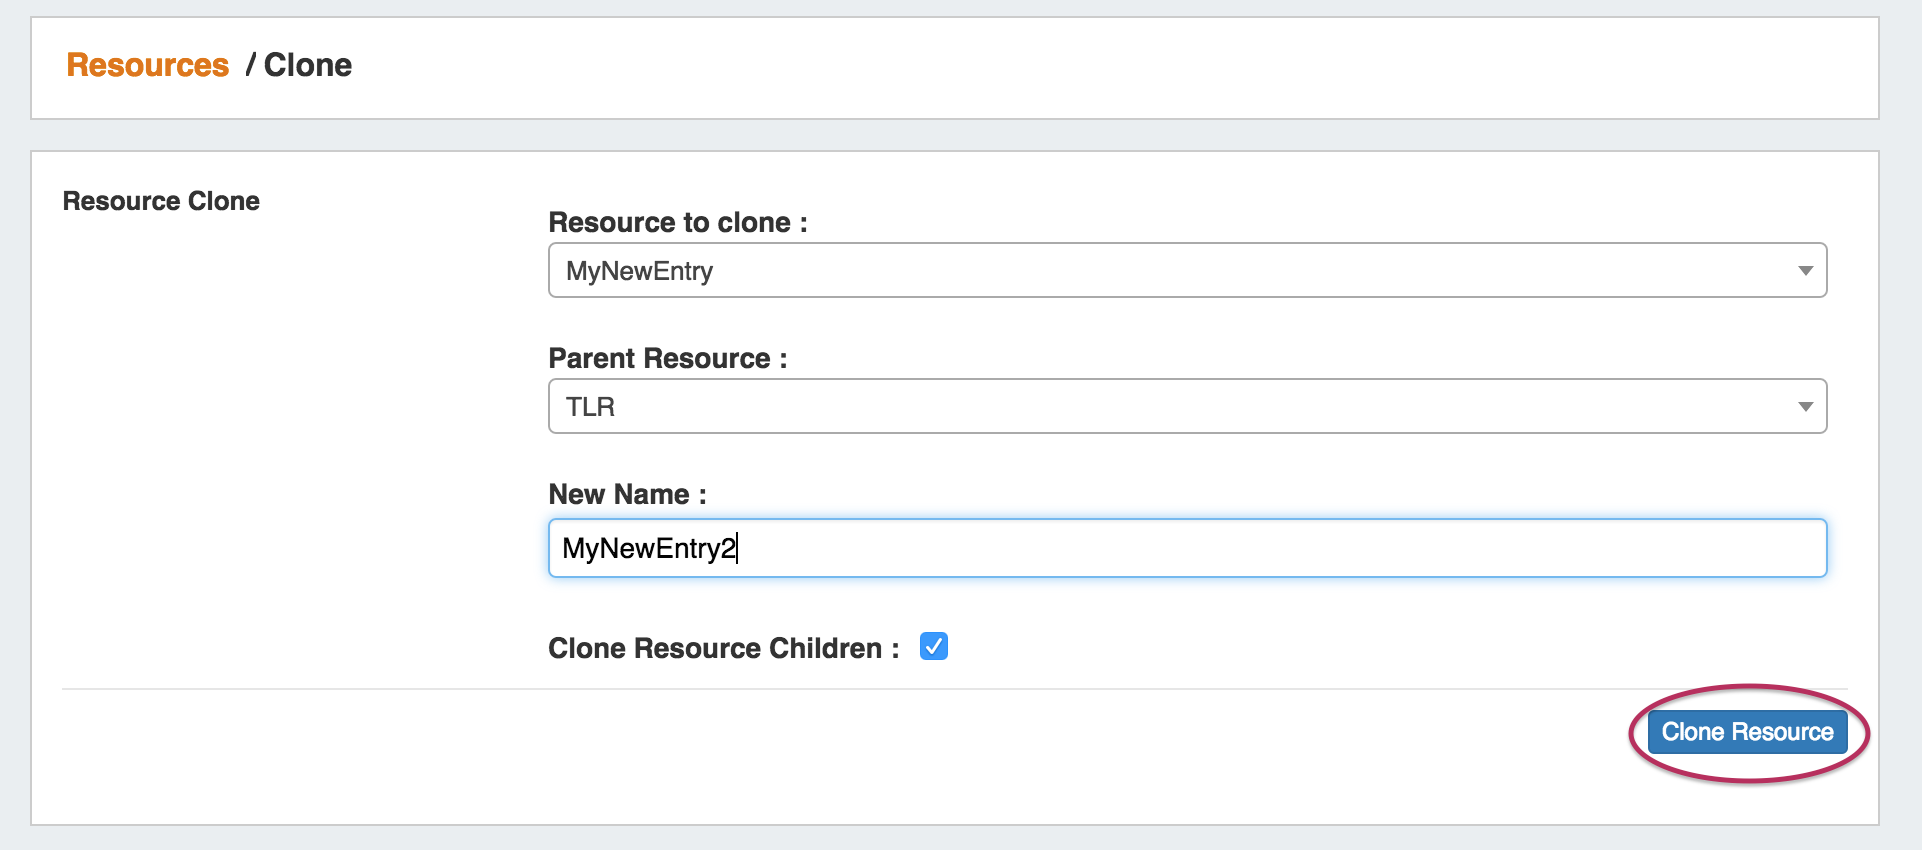 |
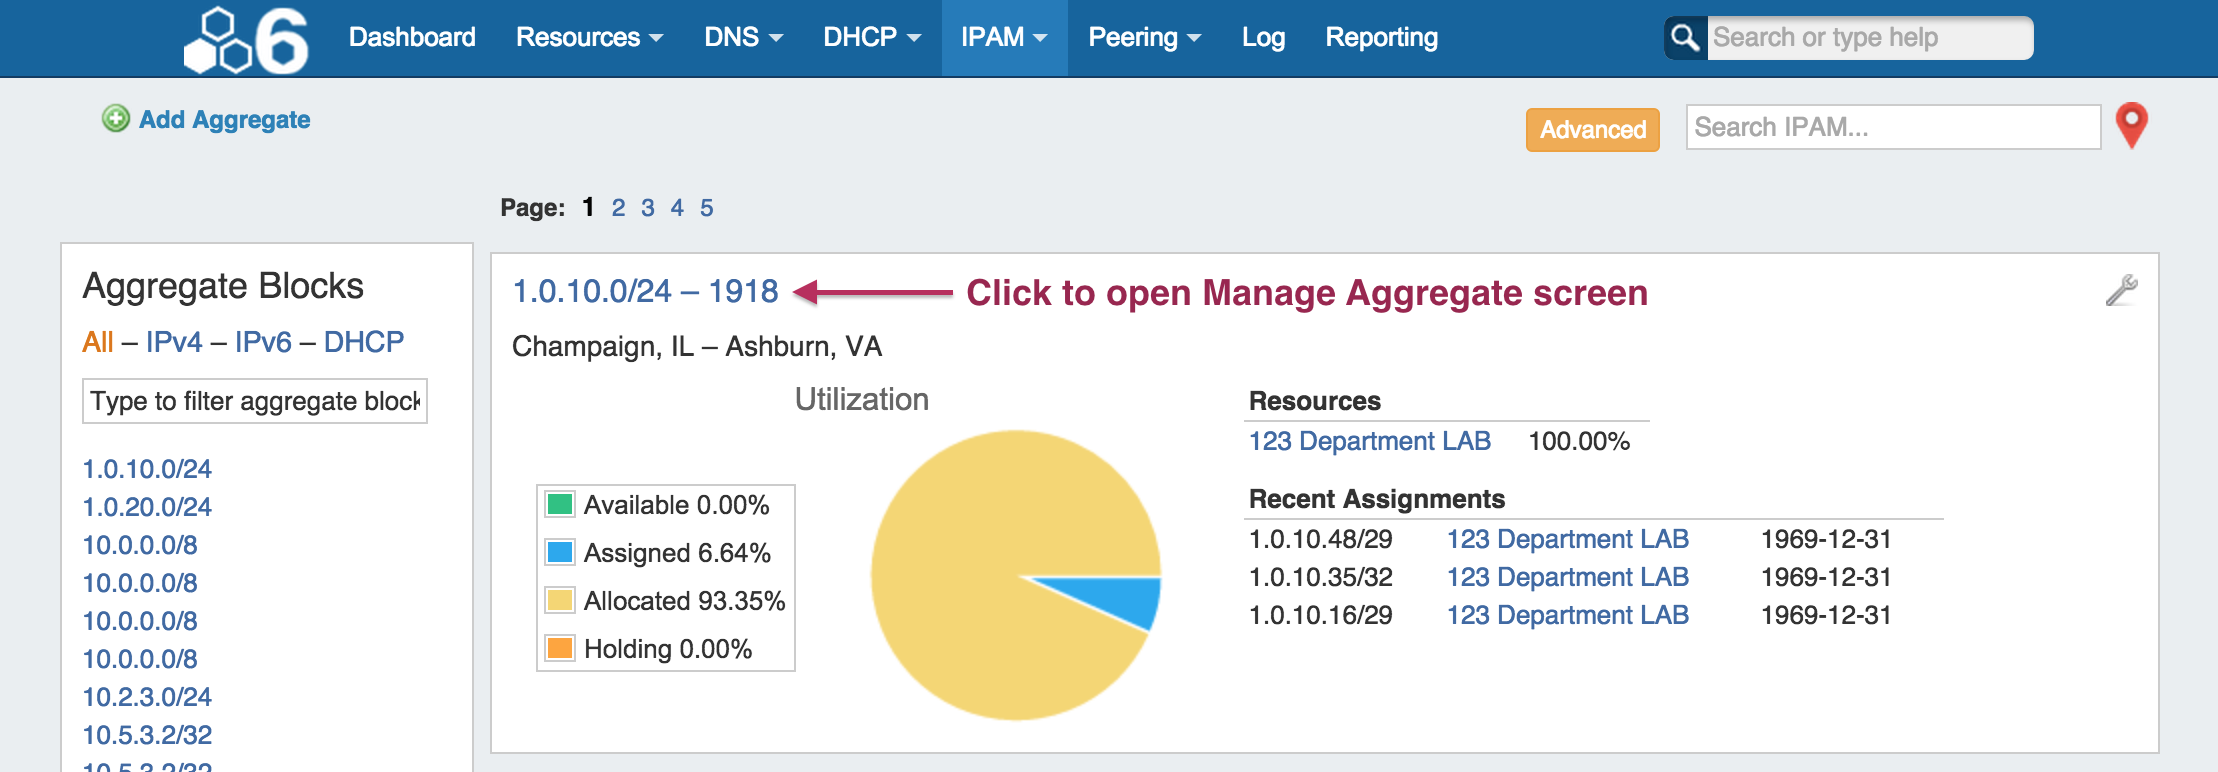
CFR-103: One-Click IPAM Aggregate Manage:
In the IPAM tab, Clicking on the header for an aggregate now directly opens up the Manage screen for that aggregate.
Click on the header for the aggregate (CIDR / Region) to open Manage Aggregate screen.
Additional Features
Scheduler Updates:
- Task List Filters: The Task Scheduler can now be filtered! Radio button filters have been added under the time information.
Select "Show: All" to see all tasks scheduled, or "Show: Active" to only show active tasks.
You may also use the text input filter box, located above and to the right of the task list, to filter tasks by Name or Repeat Info keyword.
- UI elements such as selector lists and calendar pickers have been updated.
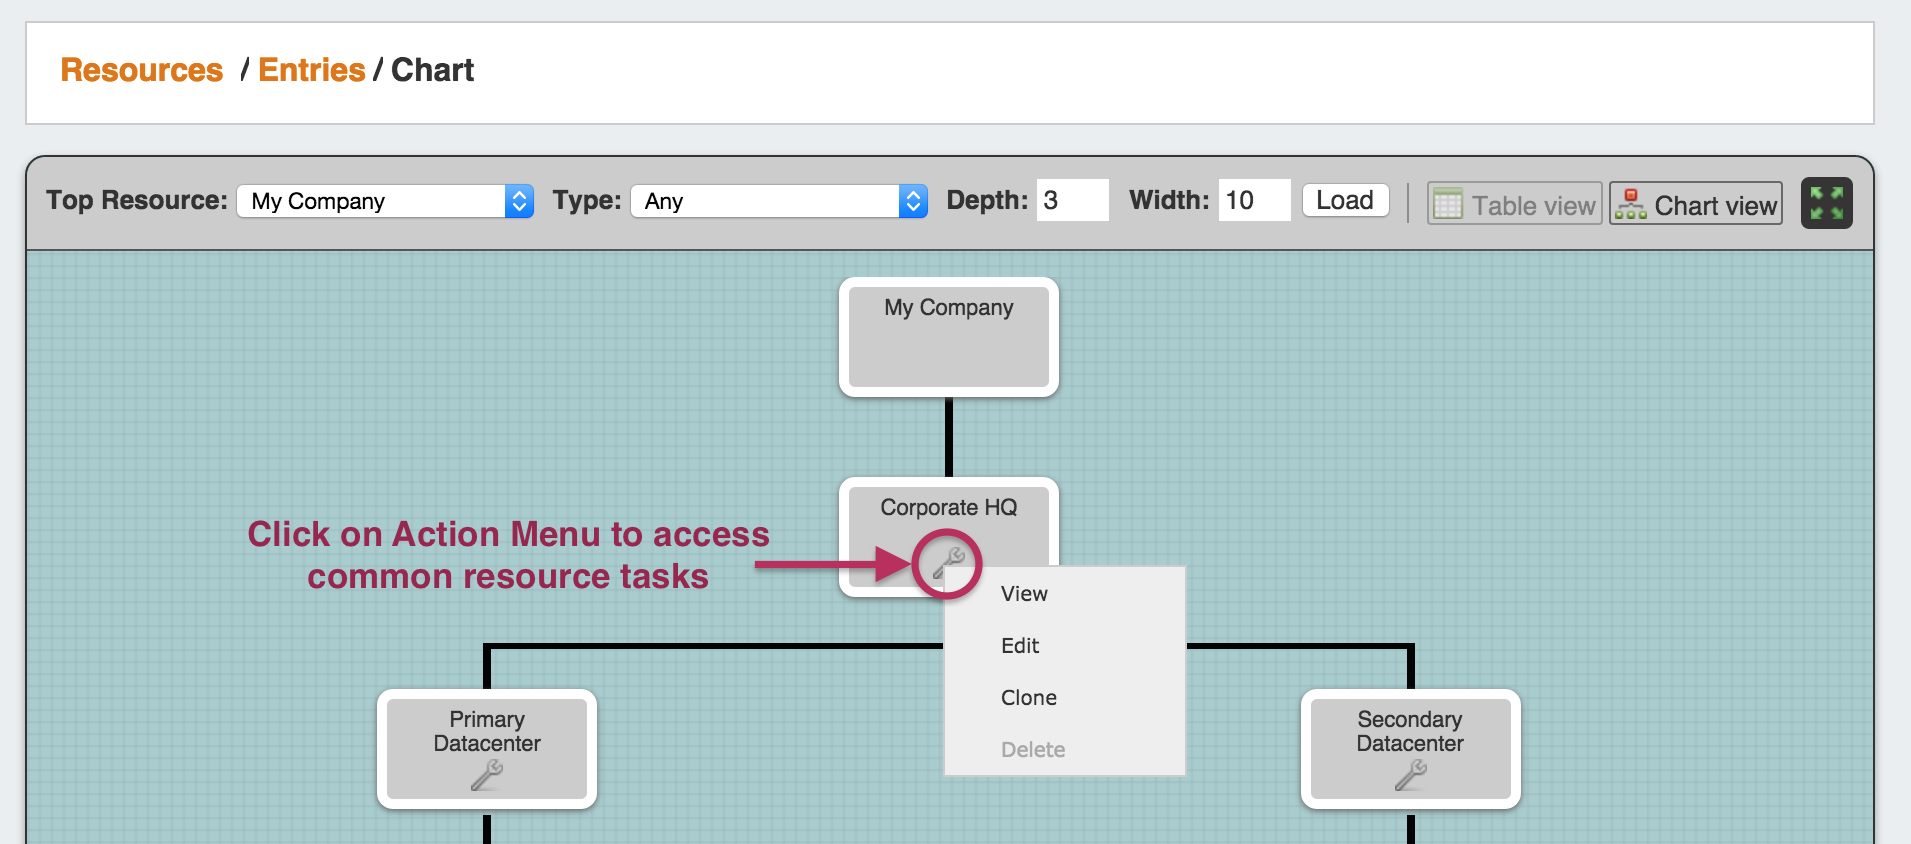
IM- 1957: Chart View Improvements:
An Action Menu has been added to entries in Chart View, allowing users to view, edit, clone, and delete entries.
| Expand |
|---|
From Chart View, left click on the Action Menu (wrench icon) to access links to the view, edit, clone, and delete functions.
|
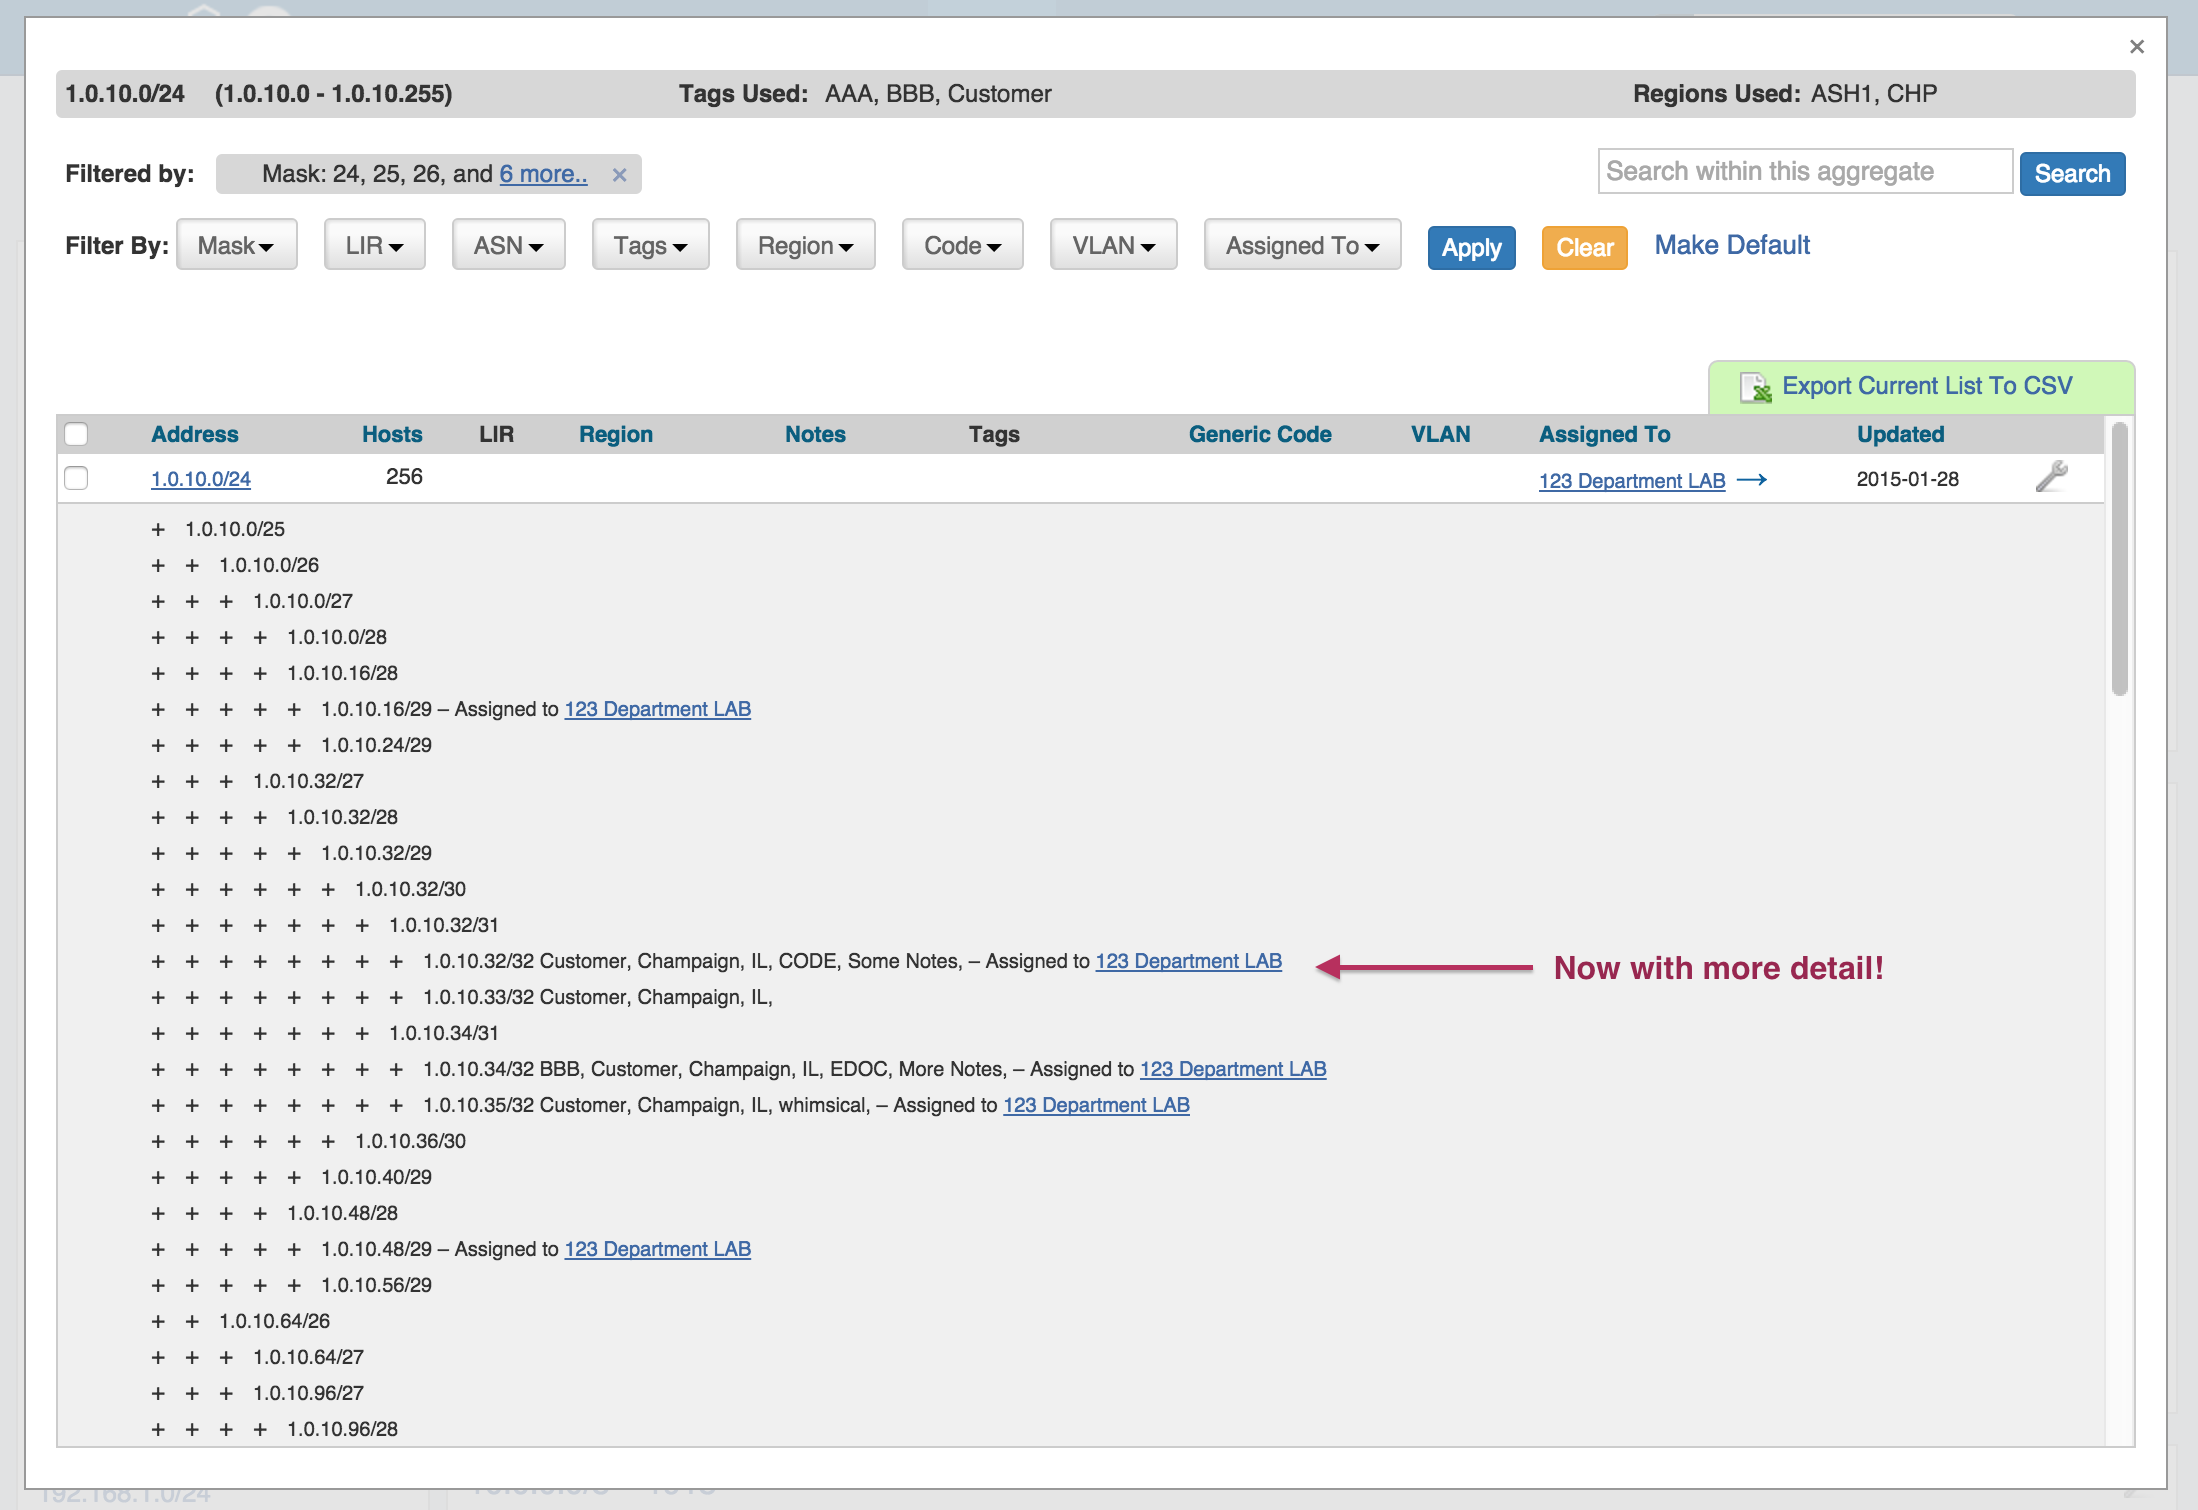
IM-1958: Improved IPAM Parent Tree View
IPAM Parent / Tree View now shows applicable Tag, Notes, and Region details for blocks.
| Expand |
|---|
In the IPAM Tab, under IPAM Manage for an aggregate, enter Parent / Tree View by selecting multiple masks and click "Apply". In this view, clicking on a parent block link expands into a detailed tree list showing child blocks. This list now has additional detailed information.
|
IM-1944/1945: DHCP Gadget Improvements
The DHCP Gadget has improved searching and Smart Assign capabilities:
- Improved searching of pools by Name, MAC, or IP address
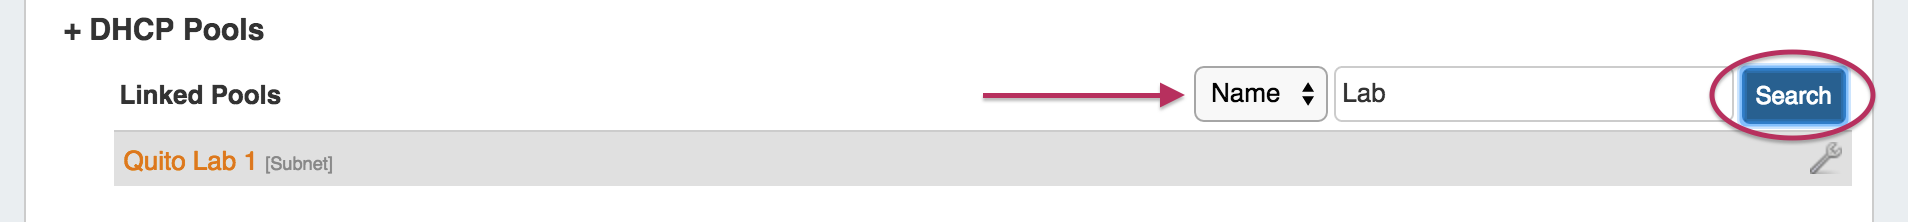
Linked Pools:
In the DHCP Gadget, select "Name", "MAC", or "IP" from the dropdown above the linked and existing pools lists. Enter the search criteria based on your selection:
- Name: Enter the text of the full or partial name of the pool
- MAC: Enter the full (ex: 00:11:22:33:44:55:66:77) or partial (:22) MAC address associated with the pool, ensuring that a colon is included in part of the search text.
- IP: Enter the full IPv4 or IPv6 CIDR of the block associated with the pool (ex: 10.0.0.0/24)
Existing Pools:
Existing Pool search uses the same criteria options as the linked pools, with the added ability to include "Region" or "Resource" criteria for IP Search:
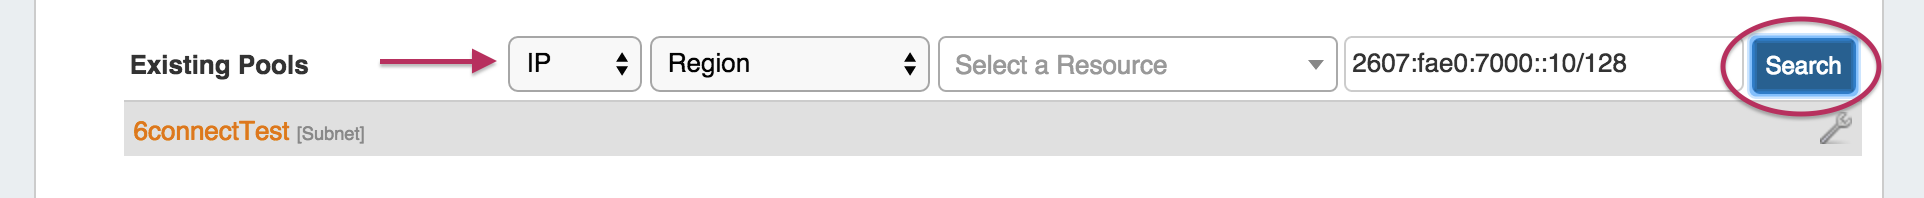
After selecting the search type and entering your search term, hit the "Search" Button and the Pools list will be filtered to matching results.
- Improved searching of pools by Name, MAC, or IP address
DHCP pool Smart Assign can now use Region, Resource, and VLAN criteria for assigning
Additional criteria options of Region, Resource, and VLAN (Domain / VLAN) are available for smart assigning a new DHCP Pool.
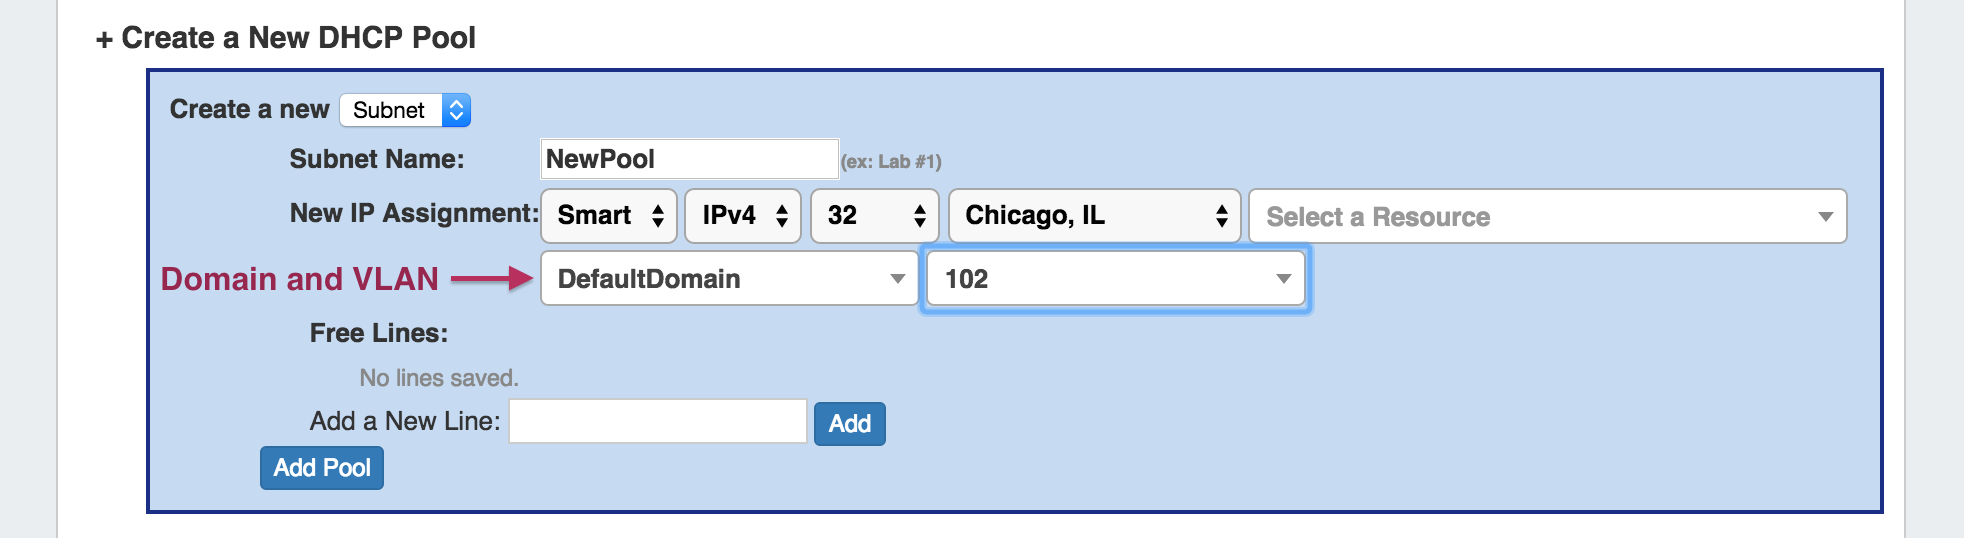
Enter your criteria, then click "Add Pool".
(A DHCP aggregate must already exist with the selected Regions / Resource / Domain / VLAN properties for the assignment to succeed.)
IM - 2014: Search Improvements
Various efficiency improvements have been made for faster search returns.
The search screen now highlights the search term in the return data.
CFR / IM-1954 IPAM API Update
The IPAM API - Get call now has a parameter "&lastUpdateTime" to query for IPAM blocks based on the last updated time. Timestamp format is in MySQL datetime format. Query may be made for blocks updated before, after, or at the exact time of the timestamp provided.
- To return blocks updated at the exact time provided, use =[MySQL datetime format] :
api/v1/api.php?target=ipam&action=get&lastUpdateTime=2015-8-19 21:08:54
- To return blocks updated prior to the given datetime, use =﹤[MySQL datetime format]:
api/v1/api.php?target=ipam&action=get&lastUpdateTime=﹤2015-8-19 21:08:54
- To return blocks updated after the given datetime, use =﹥[MySQL datetime format]:
api/v1/api.php?target=ipam&action=get&lastUpdateTime=﹥2015-8-19 21:08:54