Working with Managed Servers
The Managed Server page is where you can add a new server, view the list of existing servers, and view monitoring data on each server. From here, you may also access server settings and details for each server.
| Info | ||
|---|---|---|
| ||
Note: Managed Servers requires Python3 and Docker to be installed to support this feature. |
| Table of Contents |
|---|
The Managed Server List Interface
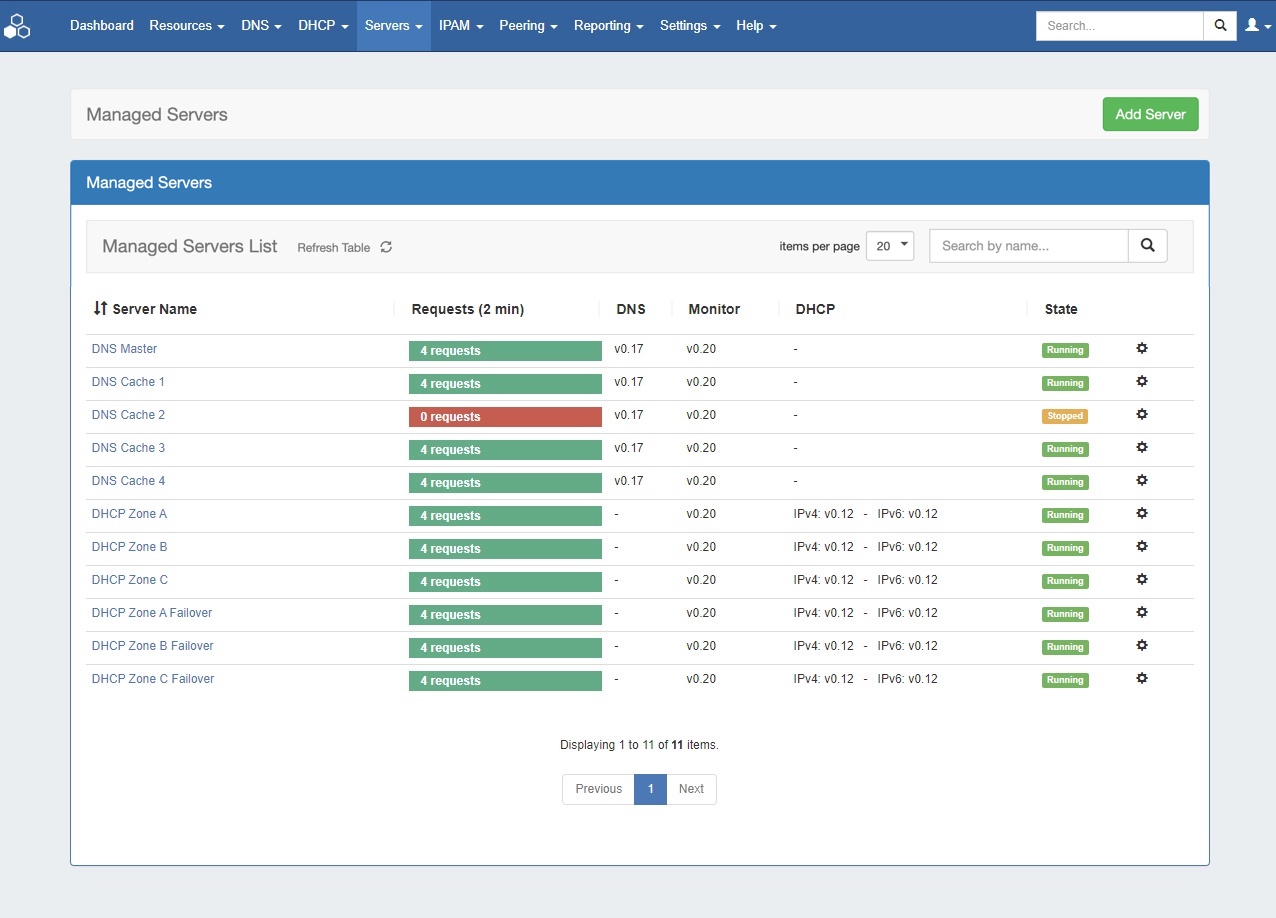
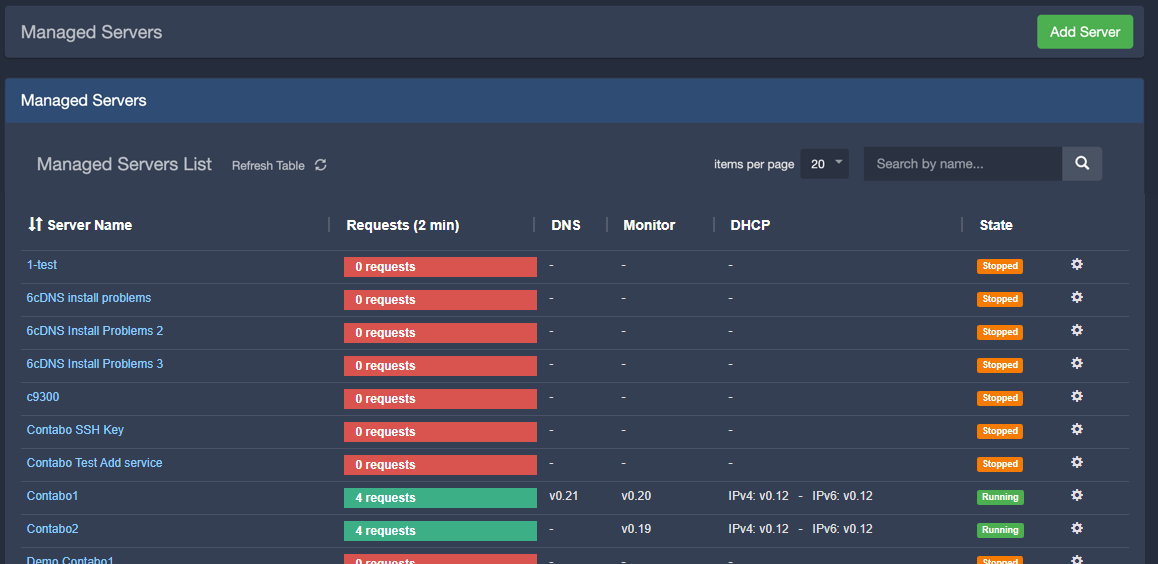
The Managed Server Section List provides server and monitoring data for each managed DNS / DHCP server.
The list provides the following information:
Server Name: The server display name, set by the user during server creation. You may click on the server name link to view server details
Requests: Requests are the heartbeat notifications received in the last 2 minutes. Requests are sent every 30 seconds, so a display of 4 or 5 requests represents a satisfactory request connection, and the request bar will show in green. For any lower value, the color of the bar will show in red.
DNS / Monitor / DHCP: The version of the component running. If the server is not running, no version will display.
State: State shows the overall state of the server - the server may be running, but without any components started. "Running" will show in green, whereas "Stopped" will display as an orange bar.
Action Menu (gear icon): Right click on the action menu (or anywhere on the row) to display available server actions
Working with the Managed Server List
The following actions may be performed when interacting with the server list:
Sort the list by clicking on the "Server Name" column, to view by Ascending / Descending order
Search / Filter the list for specific servers by entering a full or partial server name into the search box at the upper right of the list
Display more/fewer servers per page by clicking on the "Items per page" selector at the top right of the list, next to the search box
Refresh the list to check for updated information by clicking the "Refresh Table" button (rotating arrows)
Click on a server name to view / edit server details
Add New Managed Server (Setup Wizard)
| Info |
|---|
Before you begin, you will need to know following connection information for the new managed server:
|
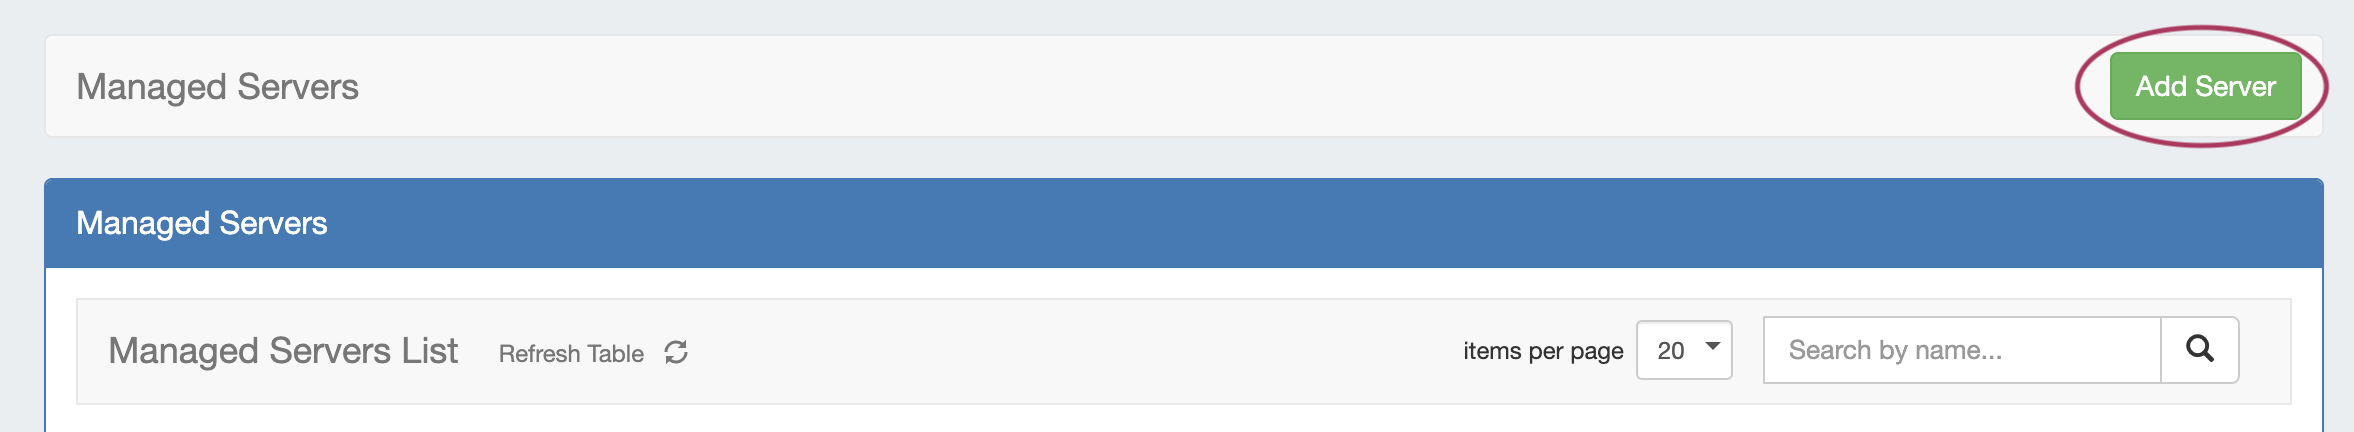
To set up a new managed server, click "Add Server" at the top right of the Managed Server Tab.
From there, proceed through each of the five steps of the Add New Server wizard, below:
| Expand | ||
|---|---|---|
| ||
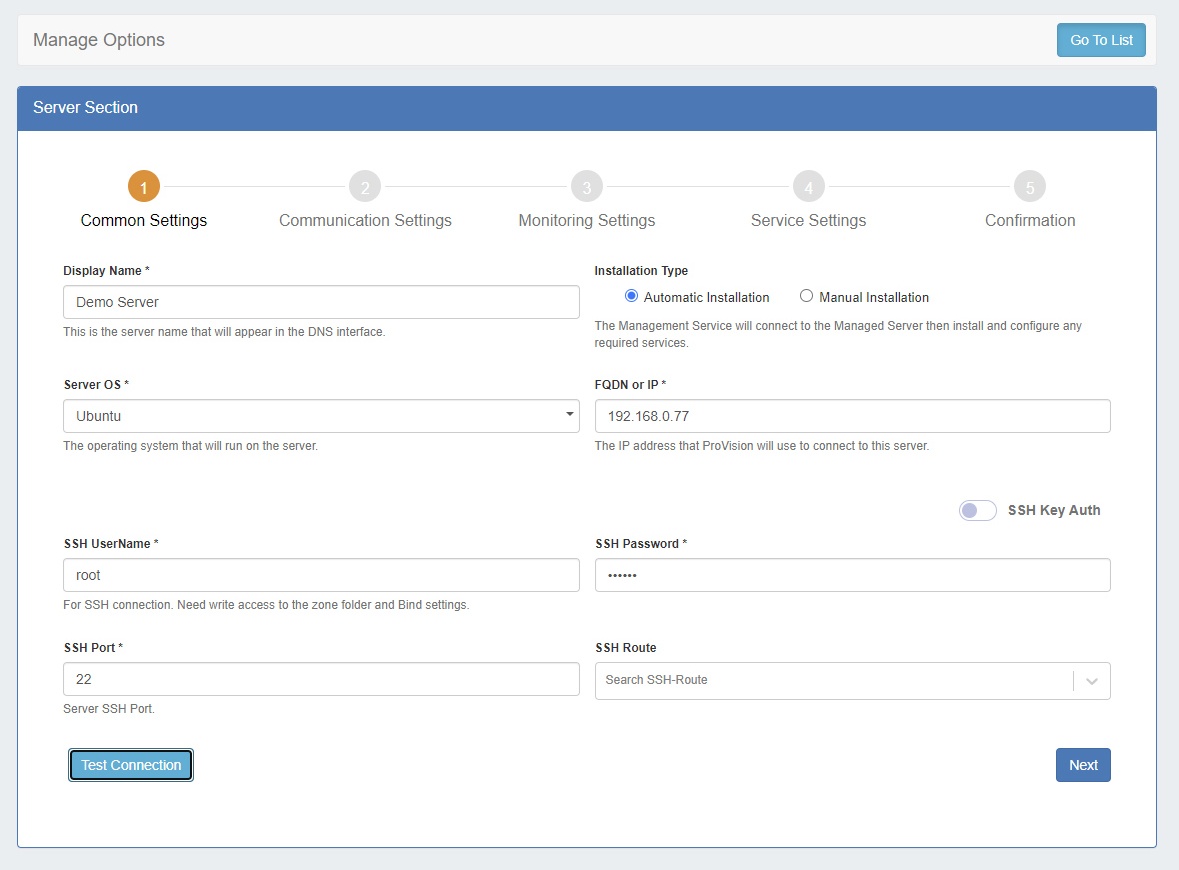
Step 1: Common Settings
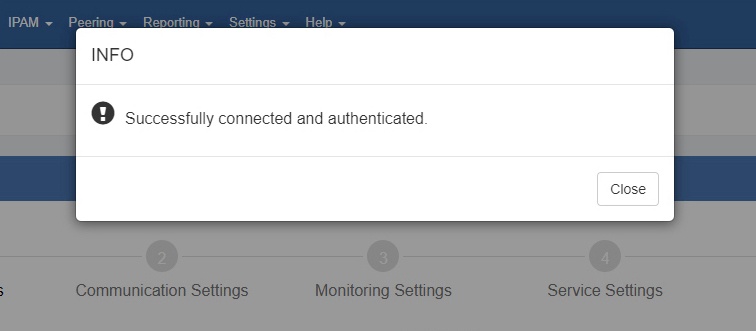
Enter the common settings for the new server: Display Name: The display name for the server Installation Type: You may choose either an automatic installation, where ProVision handles the installation, or perform a manual installation. After selecting the installation type, enter the required fields for the server, depending on the selected install type: Display Name (always required) Server OS (always required) FQDN or IP (required for automatic installations) SSH Username / Password (required for automatic installations) SSH Port (required for automatic installations) SSHRoute (optional) After entering in the common settings, click "Test Connection" to verify the connection and authentication.
Once a connection has been confirmed, click "Next". |
| Expand | ||
|---|---|---|
| ||
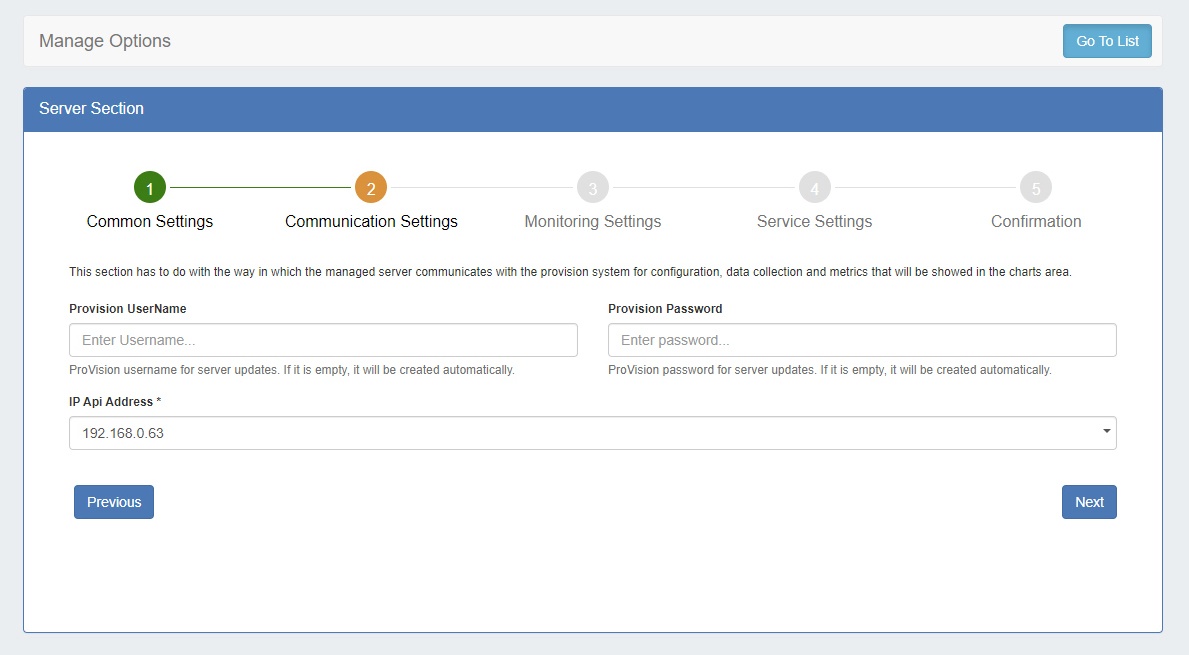
Step 2: Communication Settings
Managed servers require a ProVision user account and API IP in order to communicate configuration, data, and monitoring information. ProVision Username / Password: You may enter a specific ProVision username and password, or allow one to be automatically generated. If you enter an existing ProVision user, please ensure that the user is included under the 6cservers group and/or has full C/R/U/D resource permissions on the "6c server" resource. IP API Address: The API address the managed server should use. There are cases when the DNS servers are in different networks and should communicate with ProVision on different IPs. Click "Next" to proceed. |
| Expand | ||
|---|---|---|
| ||
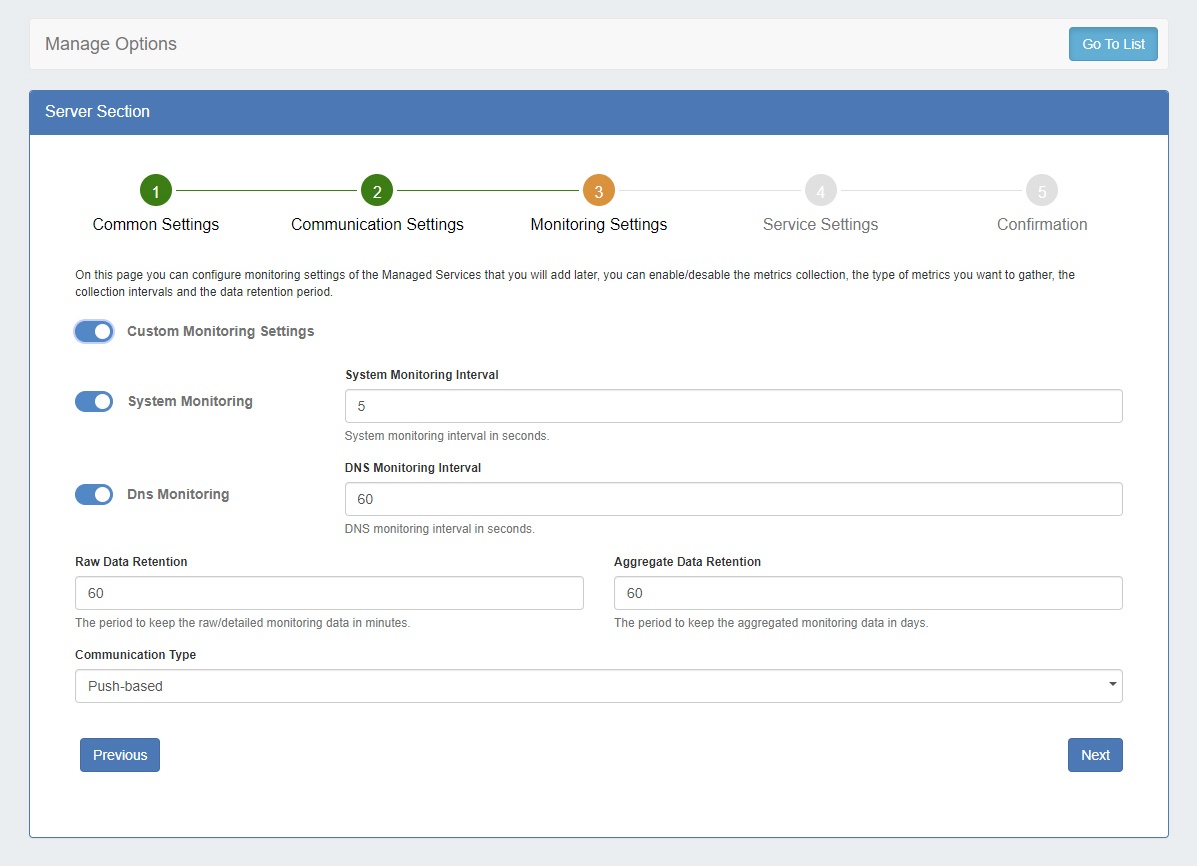
Step 3: Monitoring SettingsSelect the desired monitoring settings for the server. You may either accept the default settings, or click on the toggle for Custom Monitoring Settings to override default settings.
Options include: System Monitoring: Enable / Disable monitoring for system statistics. If enabled, enter the desired System Monitoring Interval (in seconds). More frequent intervals require larger storage, but generates more data in cases where investigation is needed. DNS Monitoring: Enable / Disable monitoring for DNS statistics. If enabled, enter the desired DNS Monitoring Interval (in seconds). DNS requests are collected for the set time interval, and then sent as an aggregated result. Raw Data Retention: How long to keep the raw data, in minutes. This affects how far back you could investigate an incident using the detailed data. Raw data requires sizable storage needs; so the default setting is 1440 min (1 day). Aggregated Data Retention: How long to keep the aggregated data, in days. Communication type: Select either Push-based (when the server pushes data to ProVision) or Pull-based (when ProVision connects to the server and pulls the data). Push-based is the preferred method, but Pull-based may be desirable in cases where a firewall would not allow inbound connections to ProVision. Click "Next" to continue. |
| Expand | ||
|---|---|---|
| ||
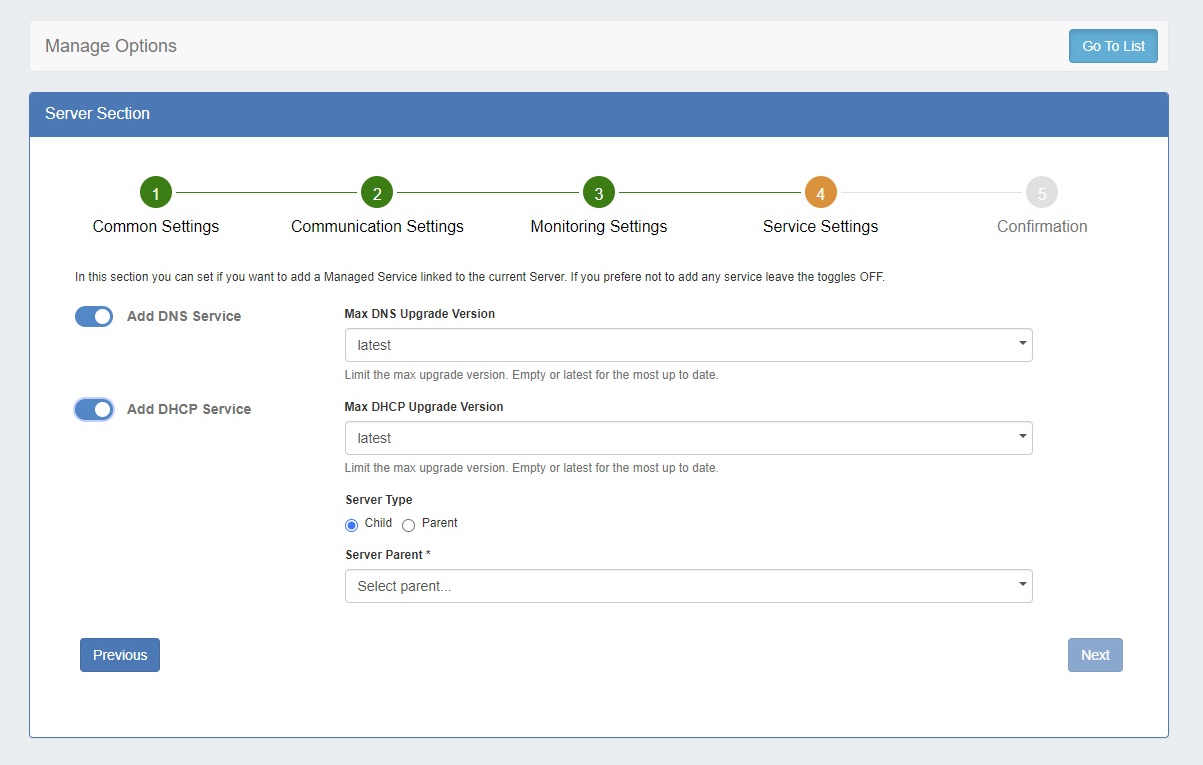
Step 4: Service SettingsHere you can select which components to install linked to the current server. If you prefer not to add a service, both toggles may be disabled.
Add DNS Service: Enable / Disable to add a DNS Managed Service link. Options include: Max DNS Upgrade Version: Select either "latest", or select a specific version to install and not upgrade beyond, in case of known issues or incompatibility. Add DHCP Service: Enable / Disable to add a DNS Managed Service link (Kea / MySQL DB). Multiple DHCP instances can connect to one database, organized as one parent with multiple children. In ProVision, "1 database" = "1 dhcpmodule resource" , and only a "parent" DHCP can have address and credentials for the database. The children don't store any information about the database and the necessary data is taken from the parent; no "dhcpmodule resource" are created for the children. Options include: Max DHCP Upgrade Version: Select either "latest", or select a specific version to install and not upgrade beyond, in case of known issues or incompatibility. Server Type: Select "Child" or "Parent".
When you are done setting up service and database settings, click "Next". |
| Expand | ||
|---|---|---|
| ||
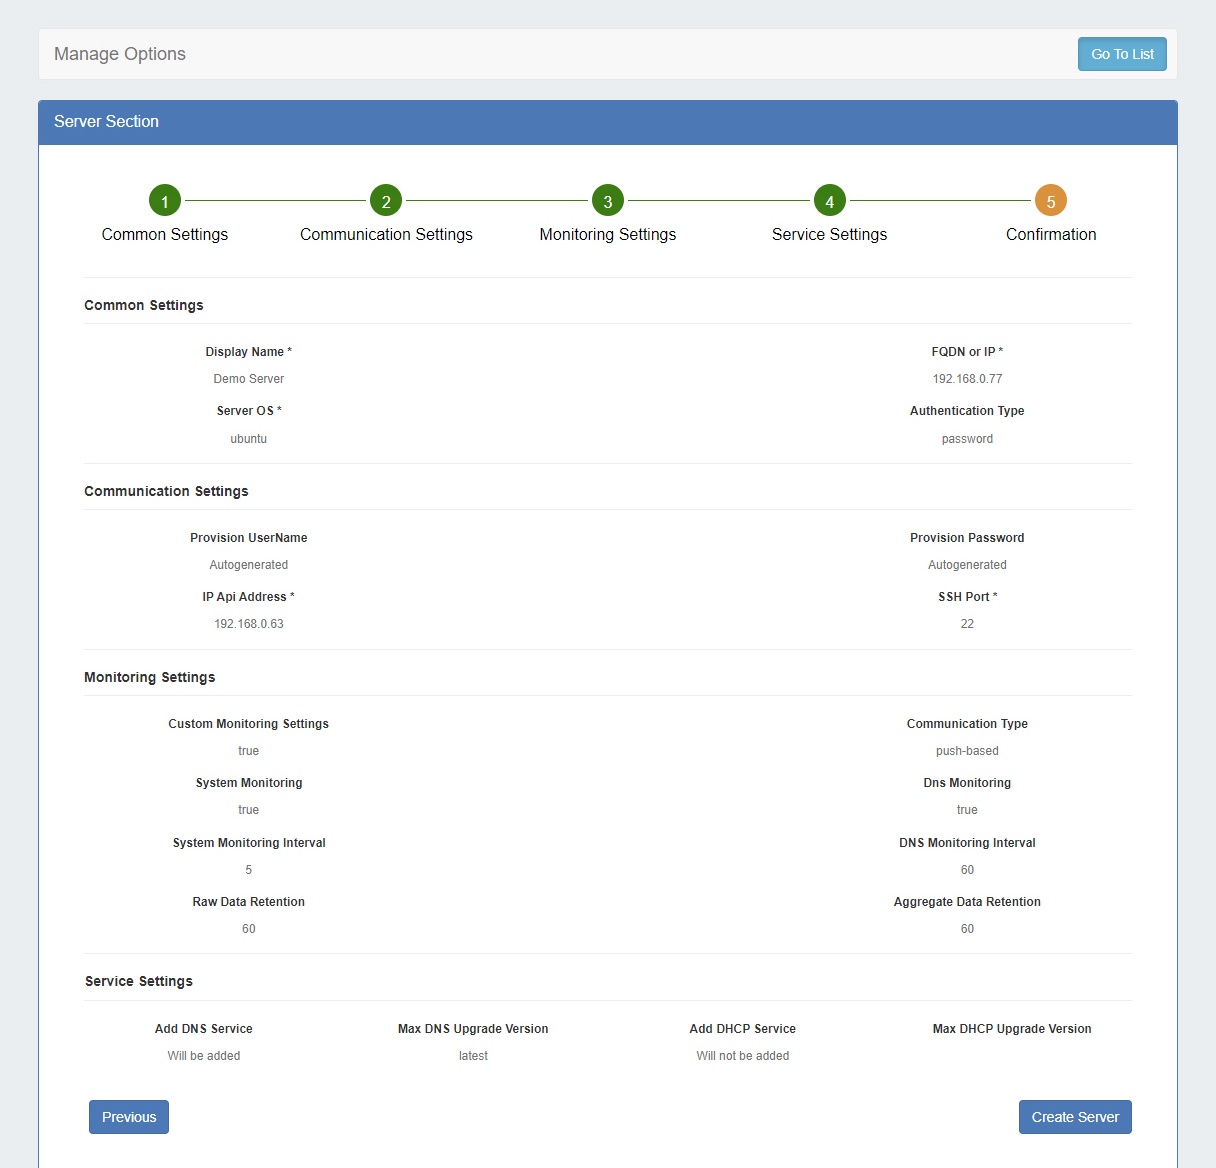
Step 5: ConfirmationThe last step to setting up a new managed server is review and confirmation.
Options selected in previous steps will display on the page - review and confirm all settings, utilizing the "Previous" button if changes are needed. Once settings are verified, click "Create Server" to complete the setup wizard. The new Managed Server will display in the Managed Server list. |
After a new server has been created, you may edit it by clicking on the server name, or view monitoring data from the Managed Server list.
View or Edit Managed Server Details
Click on a server name, or open the server action menu to view details for a managed server.
The details of a server are organized into tabs: Settings, Services, Monitoring, and RPS.

Settings
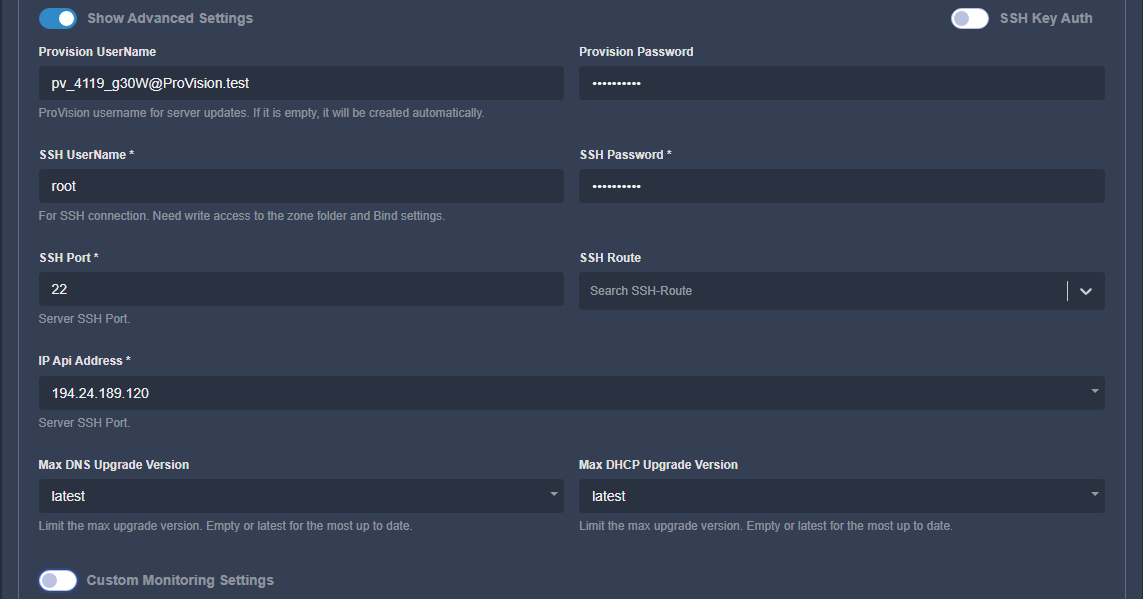
By default, only "Display Name", "Server OS" and "FQDN or IP" fields are shown.
| Expand |
|---|
Toggle on "Show Advanced Settings" to see the ssh credentials, "IP Api Address" and the max versions for each component:
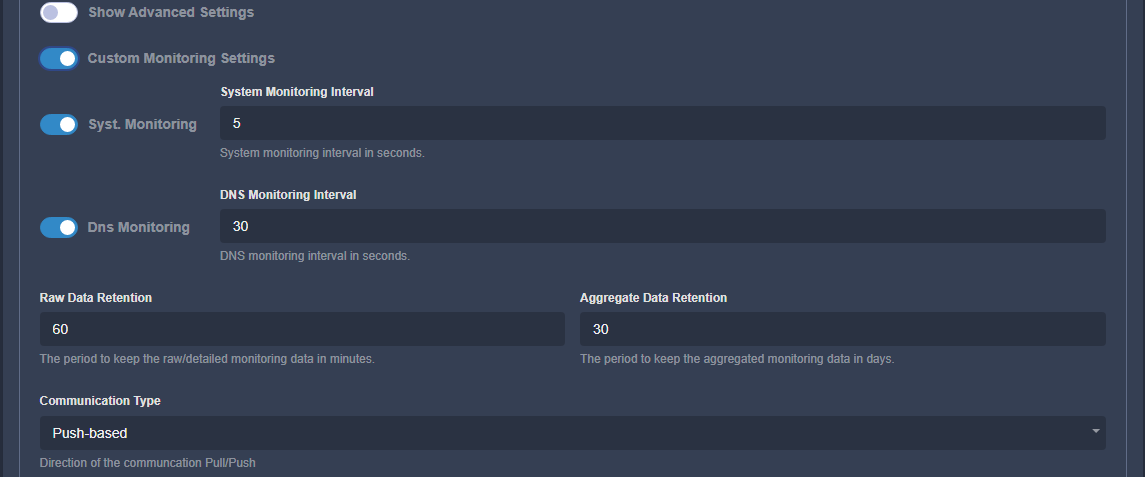
Toggle on "Custom Monitoring Settings" to view/edit the monitoring settings:
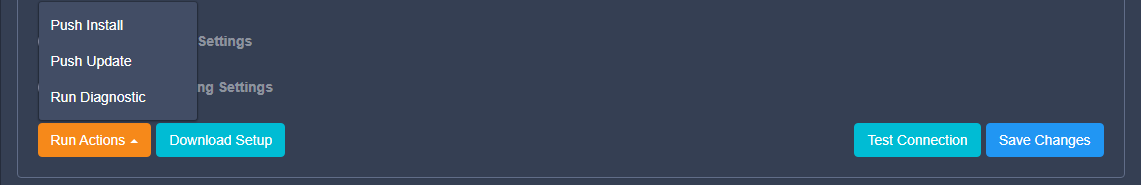
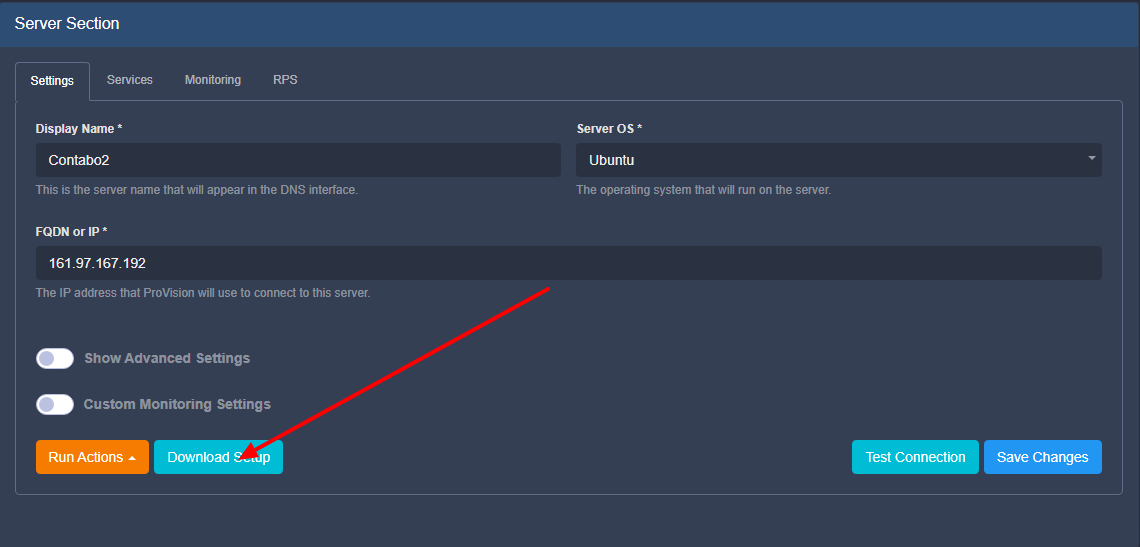
This will be toggled if the user has set custom settings earlier or during the setup. The fields are the same as in the Monitoring Settings step during setup and are described there. At the bottom left of the settings module, two buttons are available: "Run Actions" (including Push Install, Push Update, and Run Diagnostic options) and "Download Setup". On the bottom right, you may click "Test Connection" to test the SSH connection to the server.
|
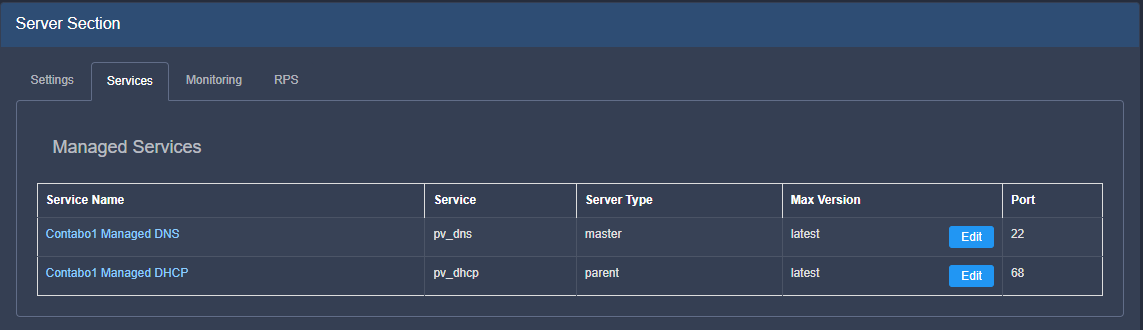
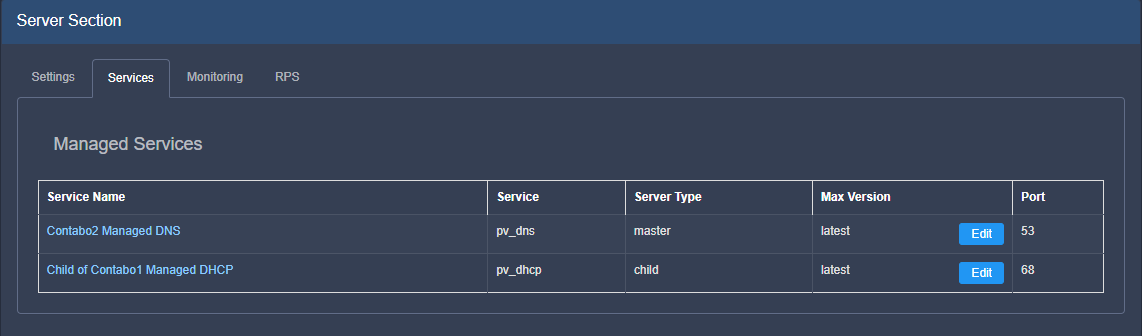
Services
Under Services, you can view the enabled components for this server.
| Expand |
|---|
Click on a component to open a new tab with component details. In case of a "child" DHCP service, the link will lead to its parent.
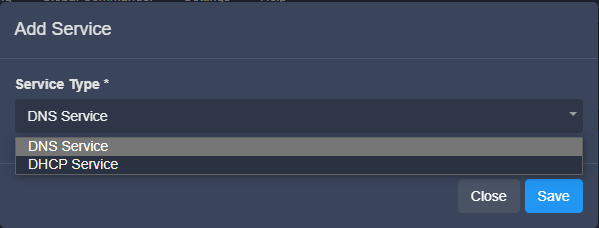
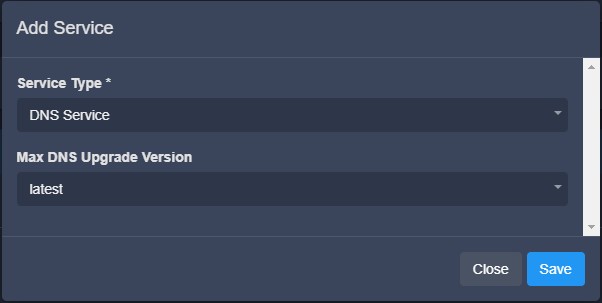
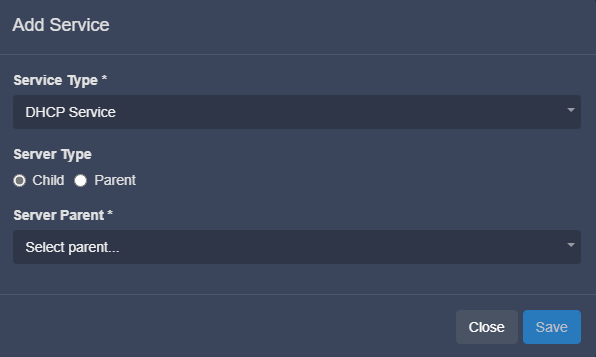
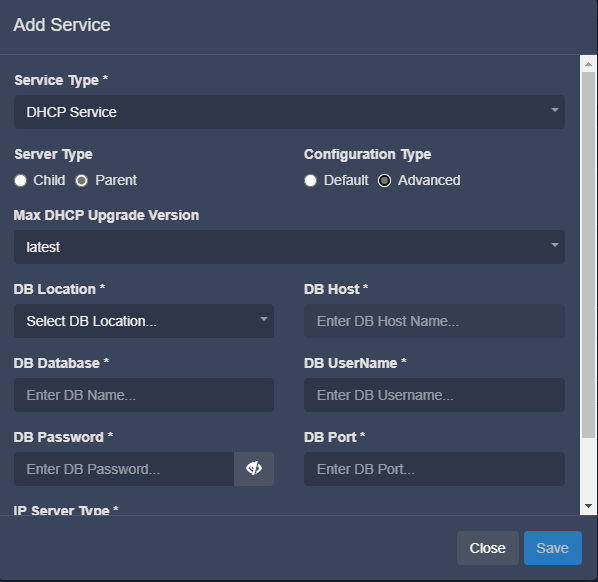
Add ServiceThe "Add Service" button shows a popup to choose the service.
For DNS there is nothing to select:
For DHCP, the interface is the same as during the setup wizard:
|
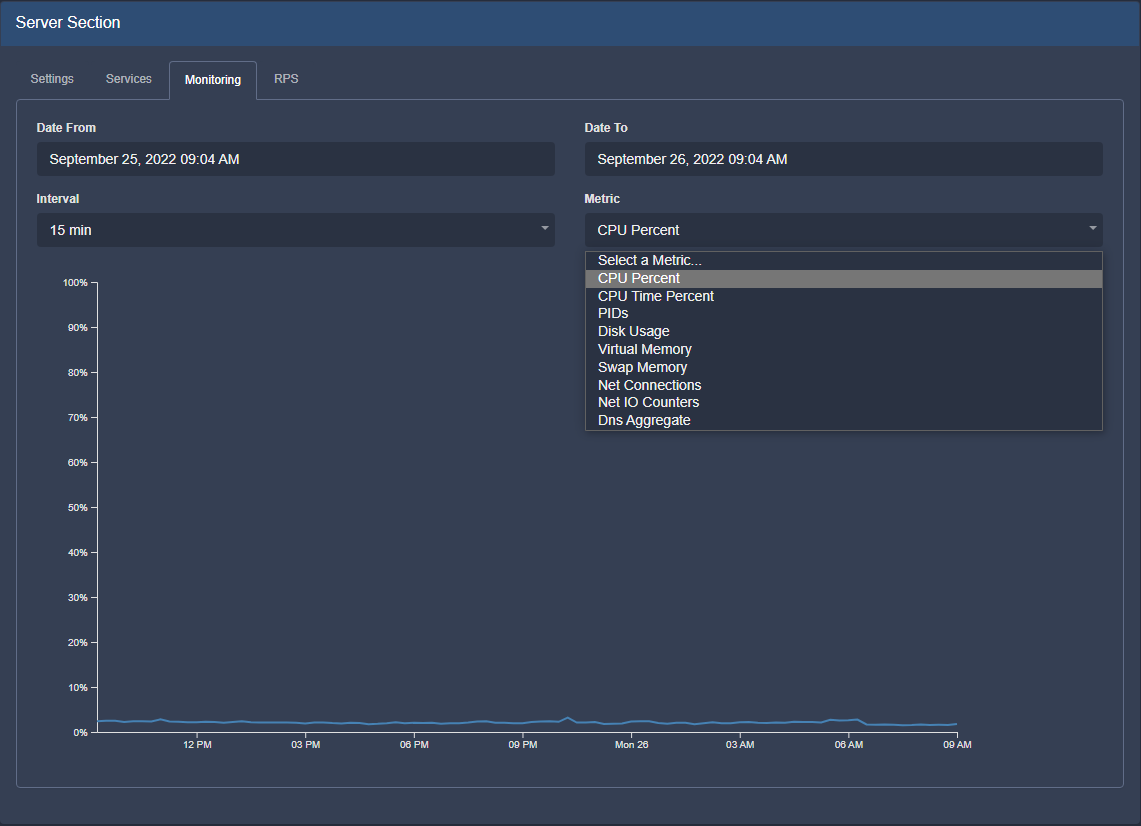
Monitoring
Under Monitoring, you can see the aggregated system statistics + "DNS aggregate":
| Expand |
|---|
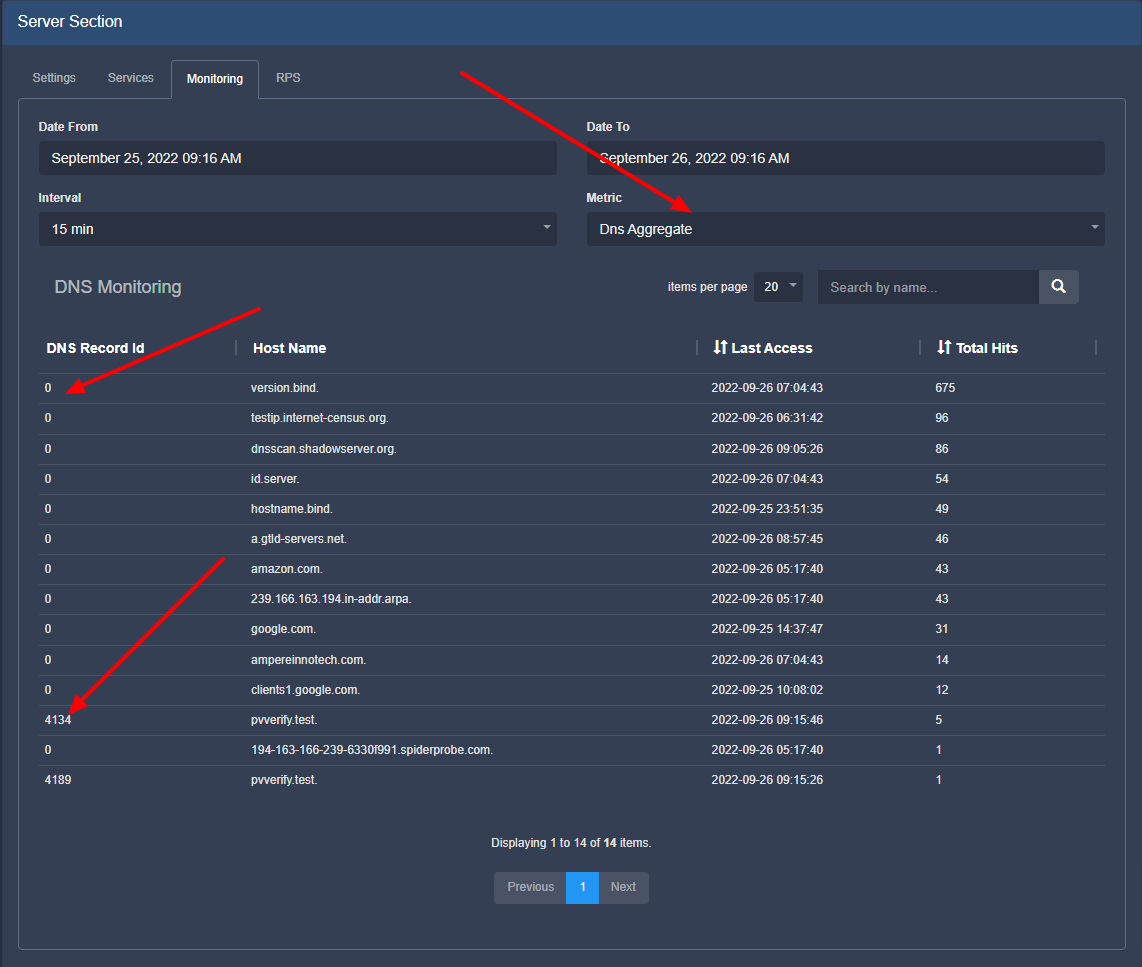
Select a certain time interval (by default, the last 24h) and aggregation interval (5 min, 15 min, 30 min, 1 hour). Note - the charts are different for the different metrics. For example, selecting "Dns Aggregate" shows a different set of information:
For the DNS records, we aggregate the overall total hits and the last time it was accessed. This is in order to be able to see the most/least used records and the ones which haven't been used for a long time and could be deleted. "Date From" and "Date To" here refer to the "Last Access". If the request is for a record, for which we don't have resource, the ID will be 0. We have "pvverify.test" two times, because one of them is for "A" request and the other is for "TXT". |
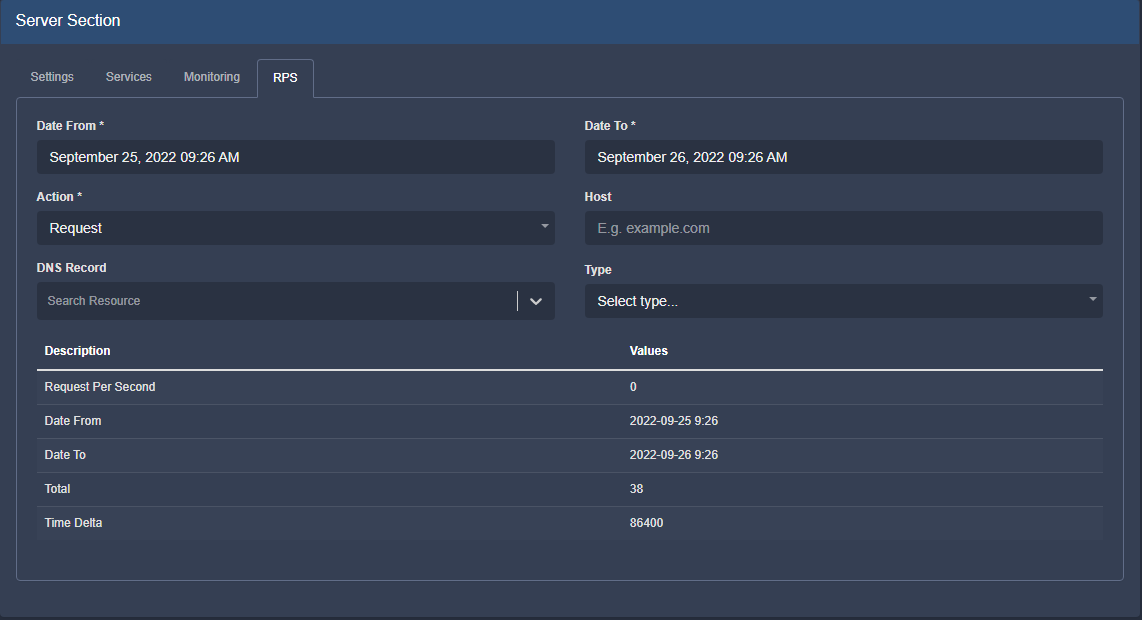
RPS (requests per second)
Under RPS, you can search for data for a given dns record.
| Expand |
|---|
Date From/ Date To: Time interval to search Action: Request or response DNS Record: Search for a specific resource Host: Search by host Type: DNS request type (A, AAAA, CNAME, MX, TXT etc.) |
Update / Install Managed Server (Existing Component)
The installation can be run more than once. If we already have running components, they will be stopped before the real installation continues.
If there is newer version of any component, it will be downloaded and used.
The overall process is:
Requirements
Python 3.6+ and Docker are the only requirements. If we run the installation with root (see below) and we have internet access, the installation process will install Docker.
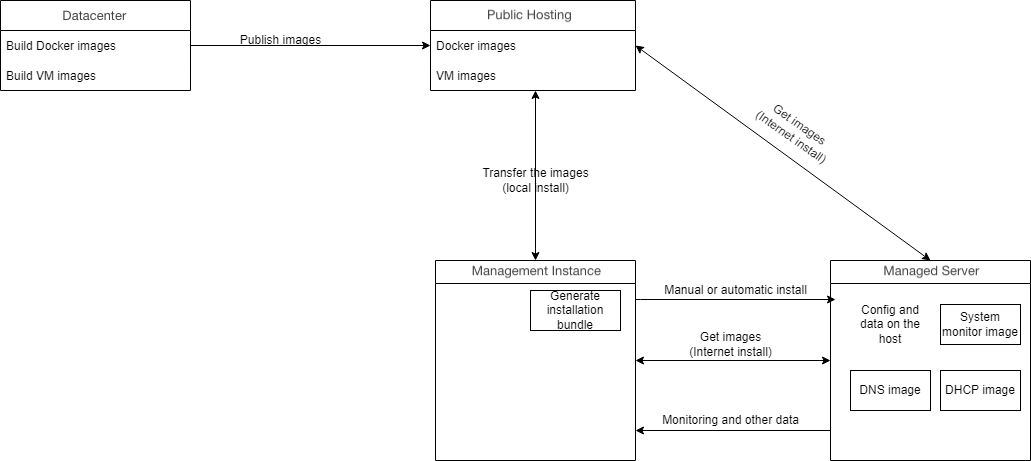
The overall process is always the same - ProVision generates an install bundle, it is transferred to the server, extracted there and run some scripts from it. This can be done by ProVision (automatic install) or by the user (manual). In case of automatic install ProVision will automate the steps, which the user would do manually. All the components can run without root access, but we need it for user creation, folders creation, network and heartbeat service setup.
Automatic (Recommended)
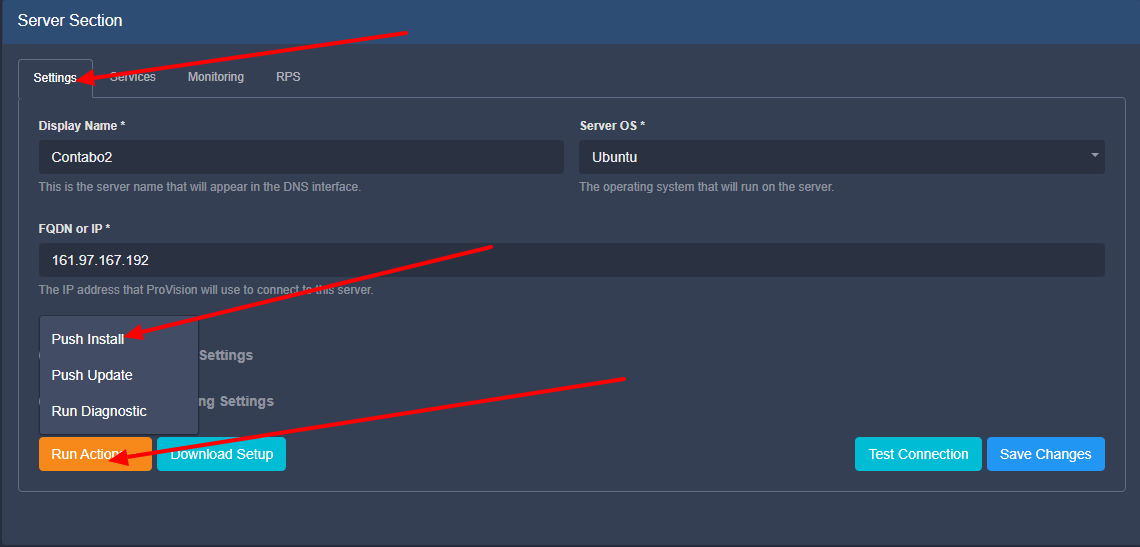
This is the recommended and easiest setup method. If you have root access, ProVision can do all the necessary actions.
Go to the details page → Settings tab → "Run Actions" → "Push Install"
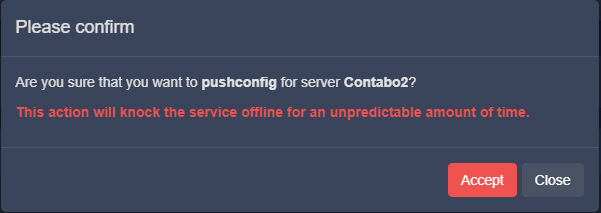
Confirmation dialog will be shown:
Popup with the progress will be shown.:
Each command/step is shown together with the overall progress.
Manual (from the command line)
This case is usually when the user doesn't want to input the root user in ProVision, but he has root access. The setup bundle should be downloaded and saved on your local computer:
The setup bundle name will be in format "setup-XXX.tar" where XXX is the resource ID of the managed server. The rest of the process is:
- copy the file to the managed server (with SCP or any other suitable way)
- extract it with "tar -xf setup-XXX.tar"
- execute "sudo /bin/bash install_python3.sh" - this should finish with "PVOK"
Without root
This is the used if root access to the server is not available. In this case, an admin with root access should first do the following:
Install docker with the relevant commands for the OS. This can be done by running "install_docker.sh" from the setup bundle with root or any other suitable way
| Code Block | ||||||
|---|---|---|---|---|---|---|
| ||||||
yum update -y
yum install -y yum-utils bind-utils

yum-config-manager \
    --add-repo \
    https://download.docker.com/linux/centos/docker-ce.repo

yum install -y docker-ce docker-ce-cli containerd.io docker-compose-plugin

systemctl enable docker
systemctl start docker

docker run hello-world |
| Code Block | ||||||
|---|---|---|---|---|---|---|
| ||||||
sudo apt-get update

sudo apt-get install -y \
    ca-certificates \
    curl \
    gnupg \
    lsb-release

# default start
KEYRING_FILE=/usr/share/keyrings/docker-archive-keyring.gpg
[ -f "$KEYRING_FILE" ] && rm $KEYRING_FILE

curl -fsSL https://download.docker.com/linux/ubuntu/gpg | sudo gpg --dearmor -o $KEYRING_FILE

echo \
  "deb [arch=$(dpkg --print-architecture) signed-by=$KEYRING_FILE] https://download.docker.com/linux/ubuntu \
  $(lsb_release -cs) stable" | sudo tee /etc/apt/sources.list.d/docker.list > /dev/null

sudo apt-get update
sudo apt-get -y install docker-ce docker-ce-cli containerd.io
sudo docker run hello-world |
Create the relevant user, add it to "docker" group, create "/provision" directory and make the created user owner of this directory.
| Code Block | ||||||
|---|---|---|---|---|---|---|
| ||||||
useradd -m <user>
passwd <user>
usermod -a -G docker <user>
mkdir -p /provision
chown -R <user>:<user> /provision |
Make the necessary network changes. This can be done by running "network_config.sh" from the install bundle
| Code Block | ||||||
|---|---|---|---|---|---|---|
| ||||||
yum update -y
yum install -y yum-utils bind-utils iptables-services

systemctl enable iptables
#iptables -I INPUT -p udp -m udp --dport 53 -j ACCEPT
#service iptables save

iptables -P INPUT ACCEPT
iptables -P FORWARD ACCEPT
iptables -P OUTPUT ACCEPT
iptables -t nat -F
iptables -t mangle -F
iptables -F
iptables -X
ip6tables -P INPUT ACCEPT
ip6tables -P FORWARD ACCEPT
ip6tables -P OUTPUT ACCEPT
ip6tables -t nat -F
ip6tables -t mangle -F
ip6tables -F
ip6tables -X
service iptables save |
| Code Block | ||||||
|---|---|---|---|---|---|---|
| ||||||
#!/usr/bin/sh
if [ "$(readlink /etc/resolv.conf)" != "/run/systemd/resolve/resolv.conf" ]; then
    ln -sf /run/systemd/resolve/resolv.conf  /etc/resolv.conf
fi

sed -i 's/^#DNSStubListener/DNSStubListener/;s/DNSStubListener=yes/DNSStubListener=no/' /etc/systemd/resolved.conf

systemctl stop systemd-resolved
systemctl start systemd-resolved |
- Create service file and edit ﹤user﹥ with the correct system user.
| Code Block | ||||||
|---|---|---|---|---|---|---|
| ||||||
# https://www.cloudsavvyit.com/3092/how-to-add-your-own-services-to-systemd-for-easier-management/
# https://www.opentechguides.com/how-to/article/centos/169/systemd-custom-service.html
# https://computingforgeeks.com/how-to-run-systemd-service-without-root-sudo/
# https://unix.stackexchange.com/a/497011

[Unit]
Description=pv_heartbeat Service, which reports the current status.
After=network.target
# StartLimitIntervalSec=0

[Service]
Type=simple
Restart=always
RestartSec=1
User=<user>
ExecStart=/usr/bin/python3 /provision/libs/pv_heartbeat.py

[Install]
# WantedBy=multi-user.target
WantedBy=deault.target
Alias=pv_heartbeat.service
|
- Make symlink to this file (replace /provision/libs/pv_heartbeat.service with the correct file path):
| Code Block | ||||
|---|---|---|---|---|
| ||||
ln -s /etc/systemd/system/pv_heartbeat.service /provision/libs/pv_heartbeat.service |
- Create sudoers file (﹤user﹥ with the correct system user) and place it in /etc/sudoers.d:
| Code Block | ||||||
|---|---|---|---|---|---|---|
| ||||||
# https://unix.stackexchange.com/a/497011

Cmnd_Alias MANAGE_PV_HEARTBEAT = \
    /bin/systemctl enable  pv_heartbeat, \
    /bin/systemctl disable pv_heartbeat, \
    /bin/systemctl start   pv_heartbeat, \
    /bin/systemctl stop    pv_heartbeat, \
    /bin/systemctl restart pv_heartbeat, \
    /bin/systemctl status  pv_heartbeat

<user> ALL = (root) NOPASSWD: MANAGE_PV_HEARTBEAT
|
| Code Block | ||||||
|---|---|---|---|---|---|---|
| ||||||
# https://unix.stackexchange.com/a/497011

Cmnd_Alias MANAGE_PV_HEARTBEAT = \
    /usr/bin/systemctl enable  pv_heartbeat, \
    /usr/bin/systemctl disable pv_heartbeat, \
    /usr/bin/systemctl start   pv_heartbeat, \
    /usr/bin/systemctl stop    pv_heartbeat, \
    /usr/bin/systemctl restart pv_heartbeat, \
    /usr/bin/systemctl status  pv_heartbeat

<user> ALL = (root) NOPASSWD: MANAGE_PV_HEARTBEAT
|
Reload the systemctl daemon:
| Code Block | ||||||
|---|---|---|---|---|---|---|
| ||||||
systemctl daemon-reload |
From this point automatic or manual setup can be done with the non-root user.
Update Managed Server
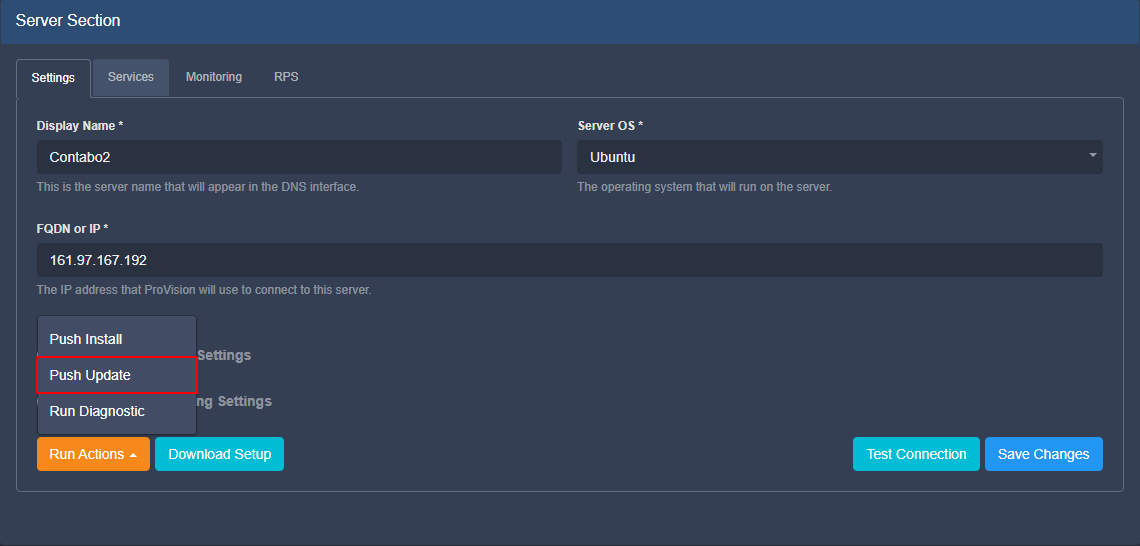
In ProVision's Managed Servers page, open the server details. Then, under the settings tab, click "Run Actions, and select "Push Update". ProVision will automatically create a backup file in /provision/backups/.
Managed Server Diagnostics / Debug
Automatic - GUI
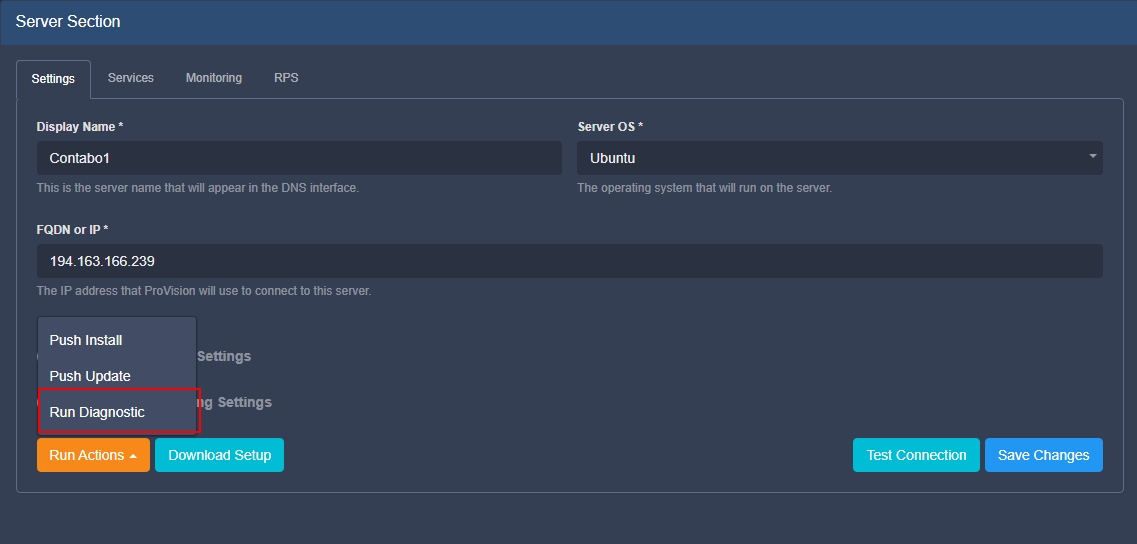
The user can run some basic diagnostics from the Managed Serve details page, under the Settings tab. Click "Run Actions", then "Run Diagnostics":
All the debug and diagnostic tools are in the monitoring component, thus it needs to be running in order to function.
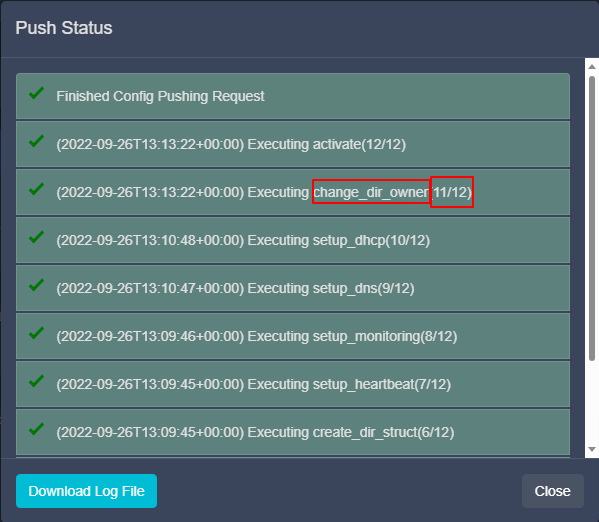
After clicking the button, a confirmation dialog will be shown with the results:
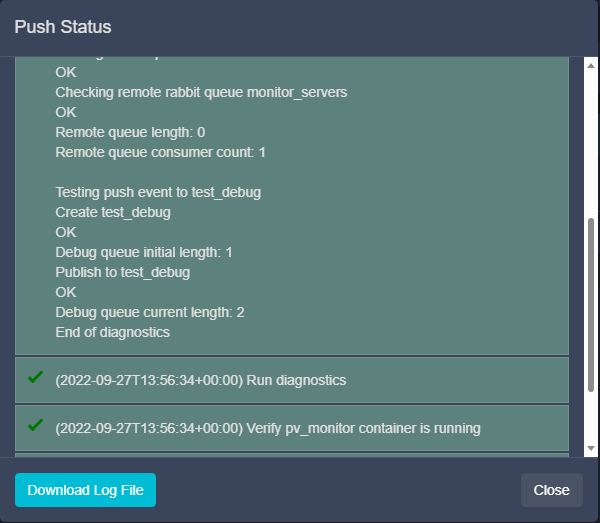
We verify if we have docker running, if the monitoring component is running and the RabbitMQ connection.
You may download the results by clicking "Download Log File", and "Close" when done.
Manual - Command Line Scripts
All the scripts are in "/provision/libs/".
All the scripts can be started with "-h" parameter to show relevant help.
- pv_install.py - used for the whole setup. The process itself is broken into separate steps, which can be executed individually with "-e/--exec-only=". The steps can be seen from the help (-h). This should be used by developers and for debugging purposes
- start_pv_*.sh - all these scripts are used to start given component. All of them support "-v/–version" to specify the version of the component to start and "-b/–bash" to start the container in debug mode. In debug mode the user will be logged into the container but without starting /start.sh (the entrypoint).
- stop_pv_*.sh - all these scripts are used to properly stop given component/container
Local
In addition to logging into any of the containers (starting the relevant script with -b/–bash) few other files are included into the monitoring component:
- mysql client for browsing the database
- dhtest (link) for DHCP testing
- dnsutils - dig, nslookup, nsupdate
- telnet
Delete Managed Server
To delete a managed server, right click on the action menu/ row for the server, and select "Delete".
Additional Information
| Children Display |
|---|