| HTML |
|---|
<div id="google_translate_element"></div>
<script type="text/javascript">
function googleTranslateElementInit() {
  new google.translate.TranslateElement({pageLanguage: 'en'}, 'google_translate_element');
}
</script>
<script type="text/javascript" src="//translate.google.com/translate_a/element.js?cb=googleTranslateElementInit"></script> |
Dashboard Widgets
The previous sections, Customizing the Dashboard, and Working with Dashboard Widgets, gave a high level overviews of the dashboard types, how to work with personal and default dashboards, and the basics of working with widgets. This section will give an overview of all available widgets and options available in each widget type.
...
| Table of Contents | ||
|---|---|---|
| ||
| Anchor | ||
|
Available Widgets
Activity Chart (Admin only)

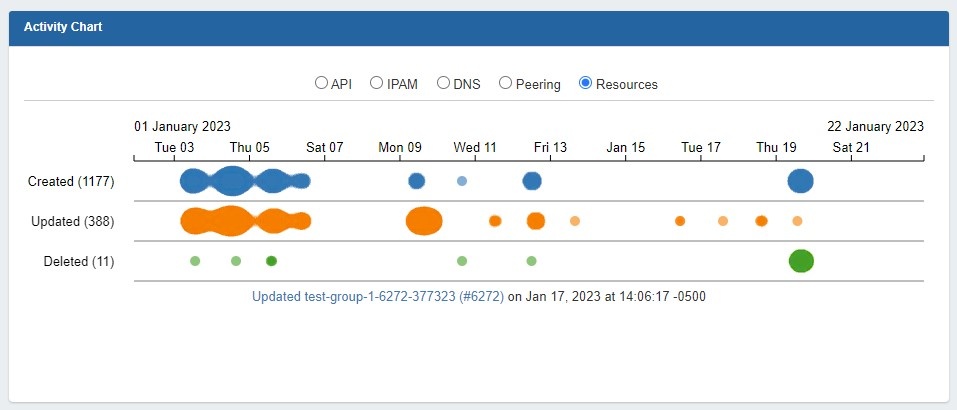
Illustrates activity level for API, IPAM, DNS, Peering, and Resource areas of ProVision. The Activity Chart is only visible to Admin users. Only Only one Activity Chart Widget may exist on a dashboard.
Activity Chart Actions:
Radio Buttons: Select Select the desired ProVision activity area to view by clicking on the radio buttons (API, IPAM, DNS, Peering, or Resources).
...
Title: Edits the title of the widget shown on the header.
Resource Tree

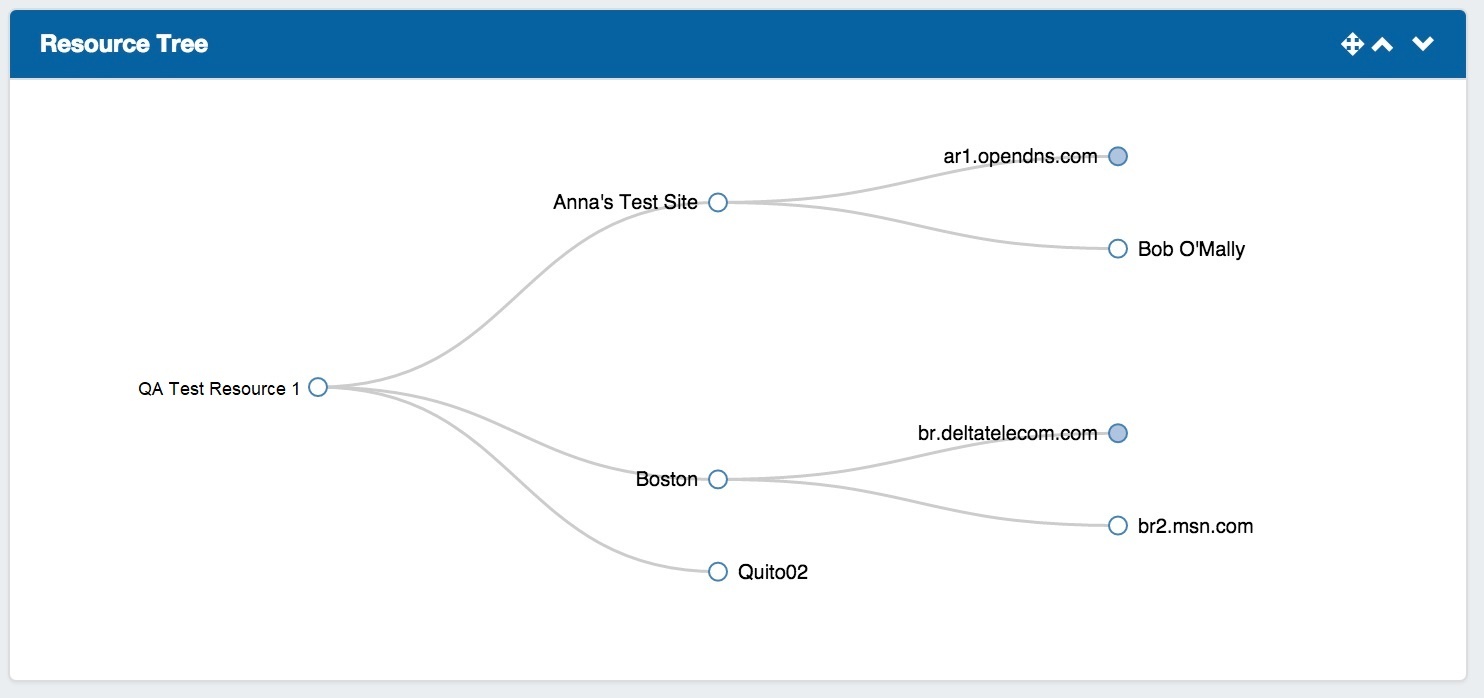
Interactive graphical display of the resource structure for a parent resource.
...
Click on Filled dots to expand the tree to show the children of that resource.
Double Right click on a resource in the tree to give you the option to navigate to the resource's entry page.
Resource Tree Edit Options:

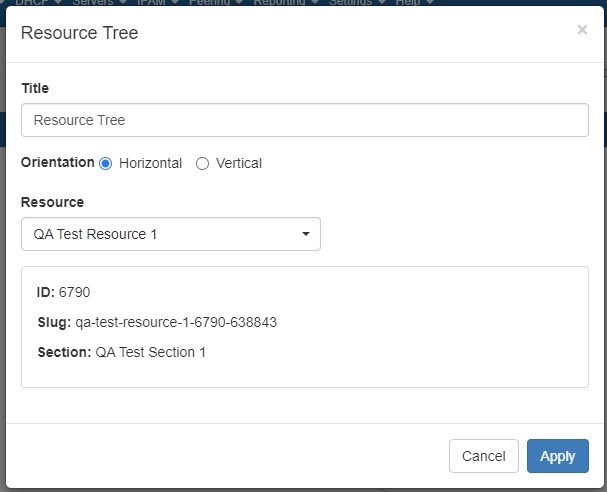
Title: Edits the title of the widget shown on the header.
...
When done editing, hit "Apply" to save your changes, or "Cancel" to exit without saving.
IP Charts


Illustrates the percentage of assigned, unassigned, allocated, and holding tank hosts for the desired combination(s) of space types and RIR(s), for the selected out of the total available hosts in ProVision viewable by the user.
...
Users may edit the title, if desired, and select from available space type and RIR(s) to create a customized view.


Title: Edits the title of the widget shown on the header.
...
Select RIR(s): Edits the RIR(s) included in charts.
Leaf nodes only: Limits chart displays to leaf nodes only.
Select mask: Edits the mask included in charts.
IP Aggregate

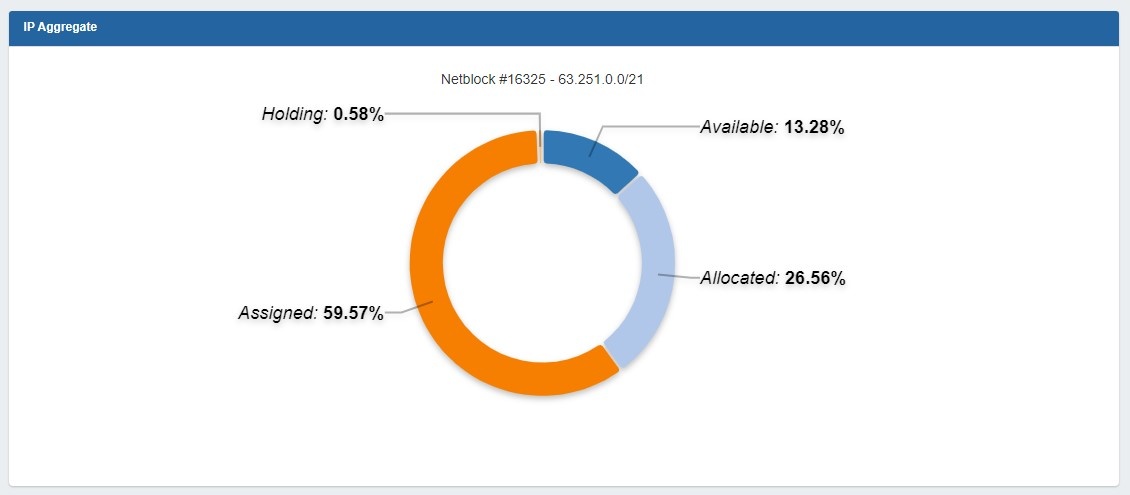
Illustrates the percentage of assigned, unassigned, allocated, and holding tank hosts for a specific netblock.
...
The IPAM Stats Widget contains read-only IPAM data on host count by status, assigned date range, assignment rate, and projected runout under three tabs.


Users may select to view IPv4, IPv6, 1918, or 1918 Multicast stats by clicking on the tab for the block type you wish to view.
RSS Feed

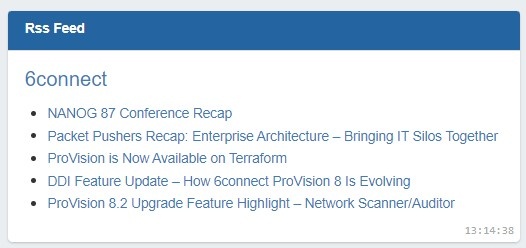
Shows the most recent five entries of a selected RSS Feed. Feed links open in a new window when clicked.
...
Feed URL: Edits the URL of the RSS Feed to show.
Status
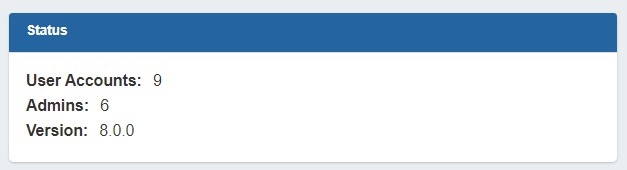
Shows 6connect ProVision status information, including number of user accounts (admin only), number of admin accounts (admin only), and current version number.
Status Edit Options:
Title: Edits the title of the widget shown on the header.
Clock

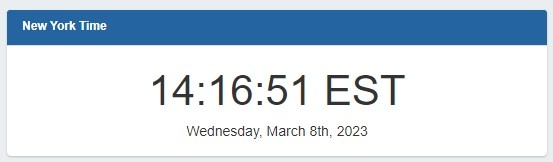
Shows the current time for the selected time zone.
Clock Edit Options:

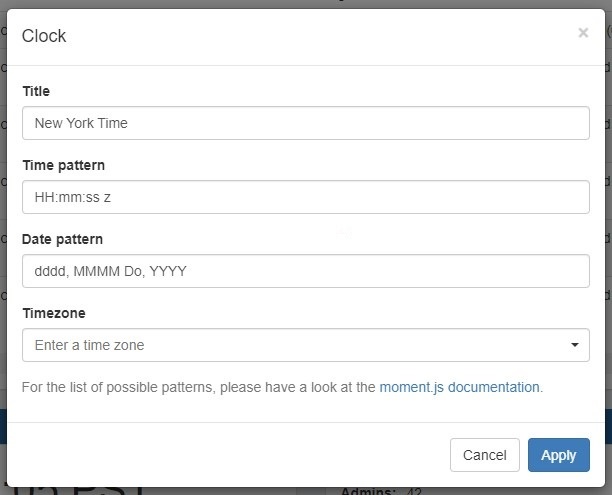
Title: Edits the title of the widget shown on the header.
...
| Expand | |||||||||||||||||||||||||||
|---|---|---|---|---|---|---|---|---|---|---|---|---|---|---|---|---|---|---|---|---|---|---|---|---|---|---|---|
| |||||||||||||||||||||||||||
|
Contact Us

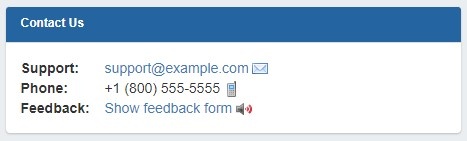
Provides support email, phone, and feedback form information. Only one Contact Us Widget may exist on a dashboard.
...
| Info |
|---|
| Note: Support phone number and email address are set from the ProVision Admin settings. |
Logs
The Logs Dashboard Widget displays the most recent 'x' number of logs for a specified search term, such as resource name, task, id number, username, and so forth.
...
Markdown Content: Area to enter the markdown content.
Links

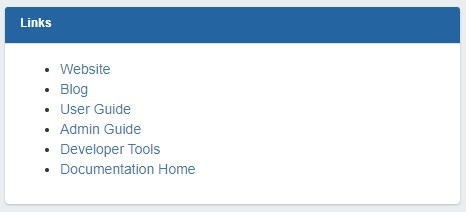
Provides a list of website links. Multiple Links Widgets may exist on a dashboard.
Link Edit Options:

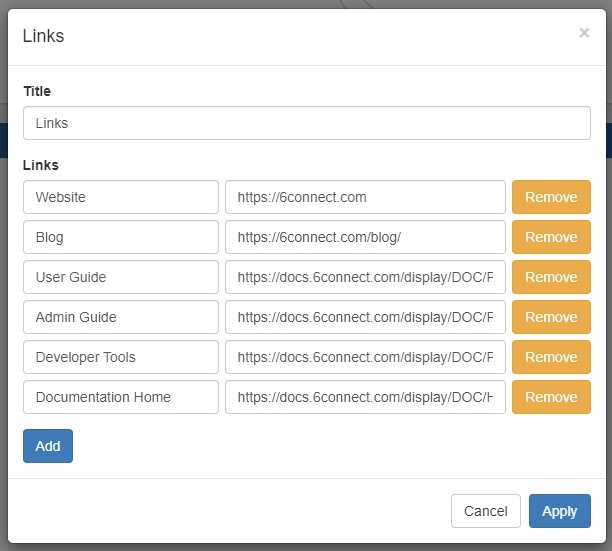
Title: Edits the title of the widget shown on the header.
...