The Dashboard
The Dashboard is your first stop when logging into 6connect Provision, giving you a quick graphical status overview as well as convenient links for reference and support. The Dashboard is comprised of modular "Widgets" that show different types of information. These Widgets may be added, moved, edited, and customized to create personalized Dashboards.
There are two levels of Dashboards:
Default Dashboard: The Default Dashboard is a shared dashboard for all users of the ProVision instance. It may only be edited by admin level users, but it is viewable by all users.
Individual Users' Dashboards: Additional Dashboards may be created by individual users. These dashboards are tied to the user logged in, and are only viewable / editable by that user.
| Info | ||
|---|---|---|
| ||
| Note: An individual's permission levels may limit what that user can view in both default and personal Dashboards. Although all users can view the Default Dashboard, they may be not be able to view all elements or data inside the dashboard. |
| Table of Contents |
|---|
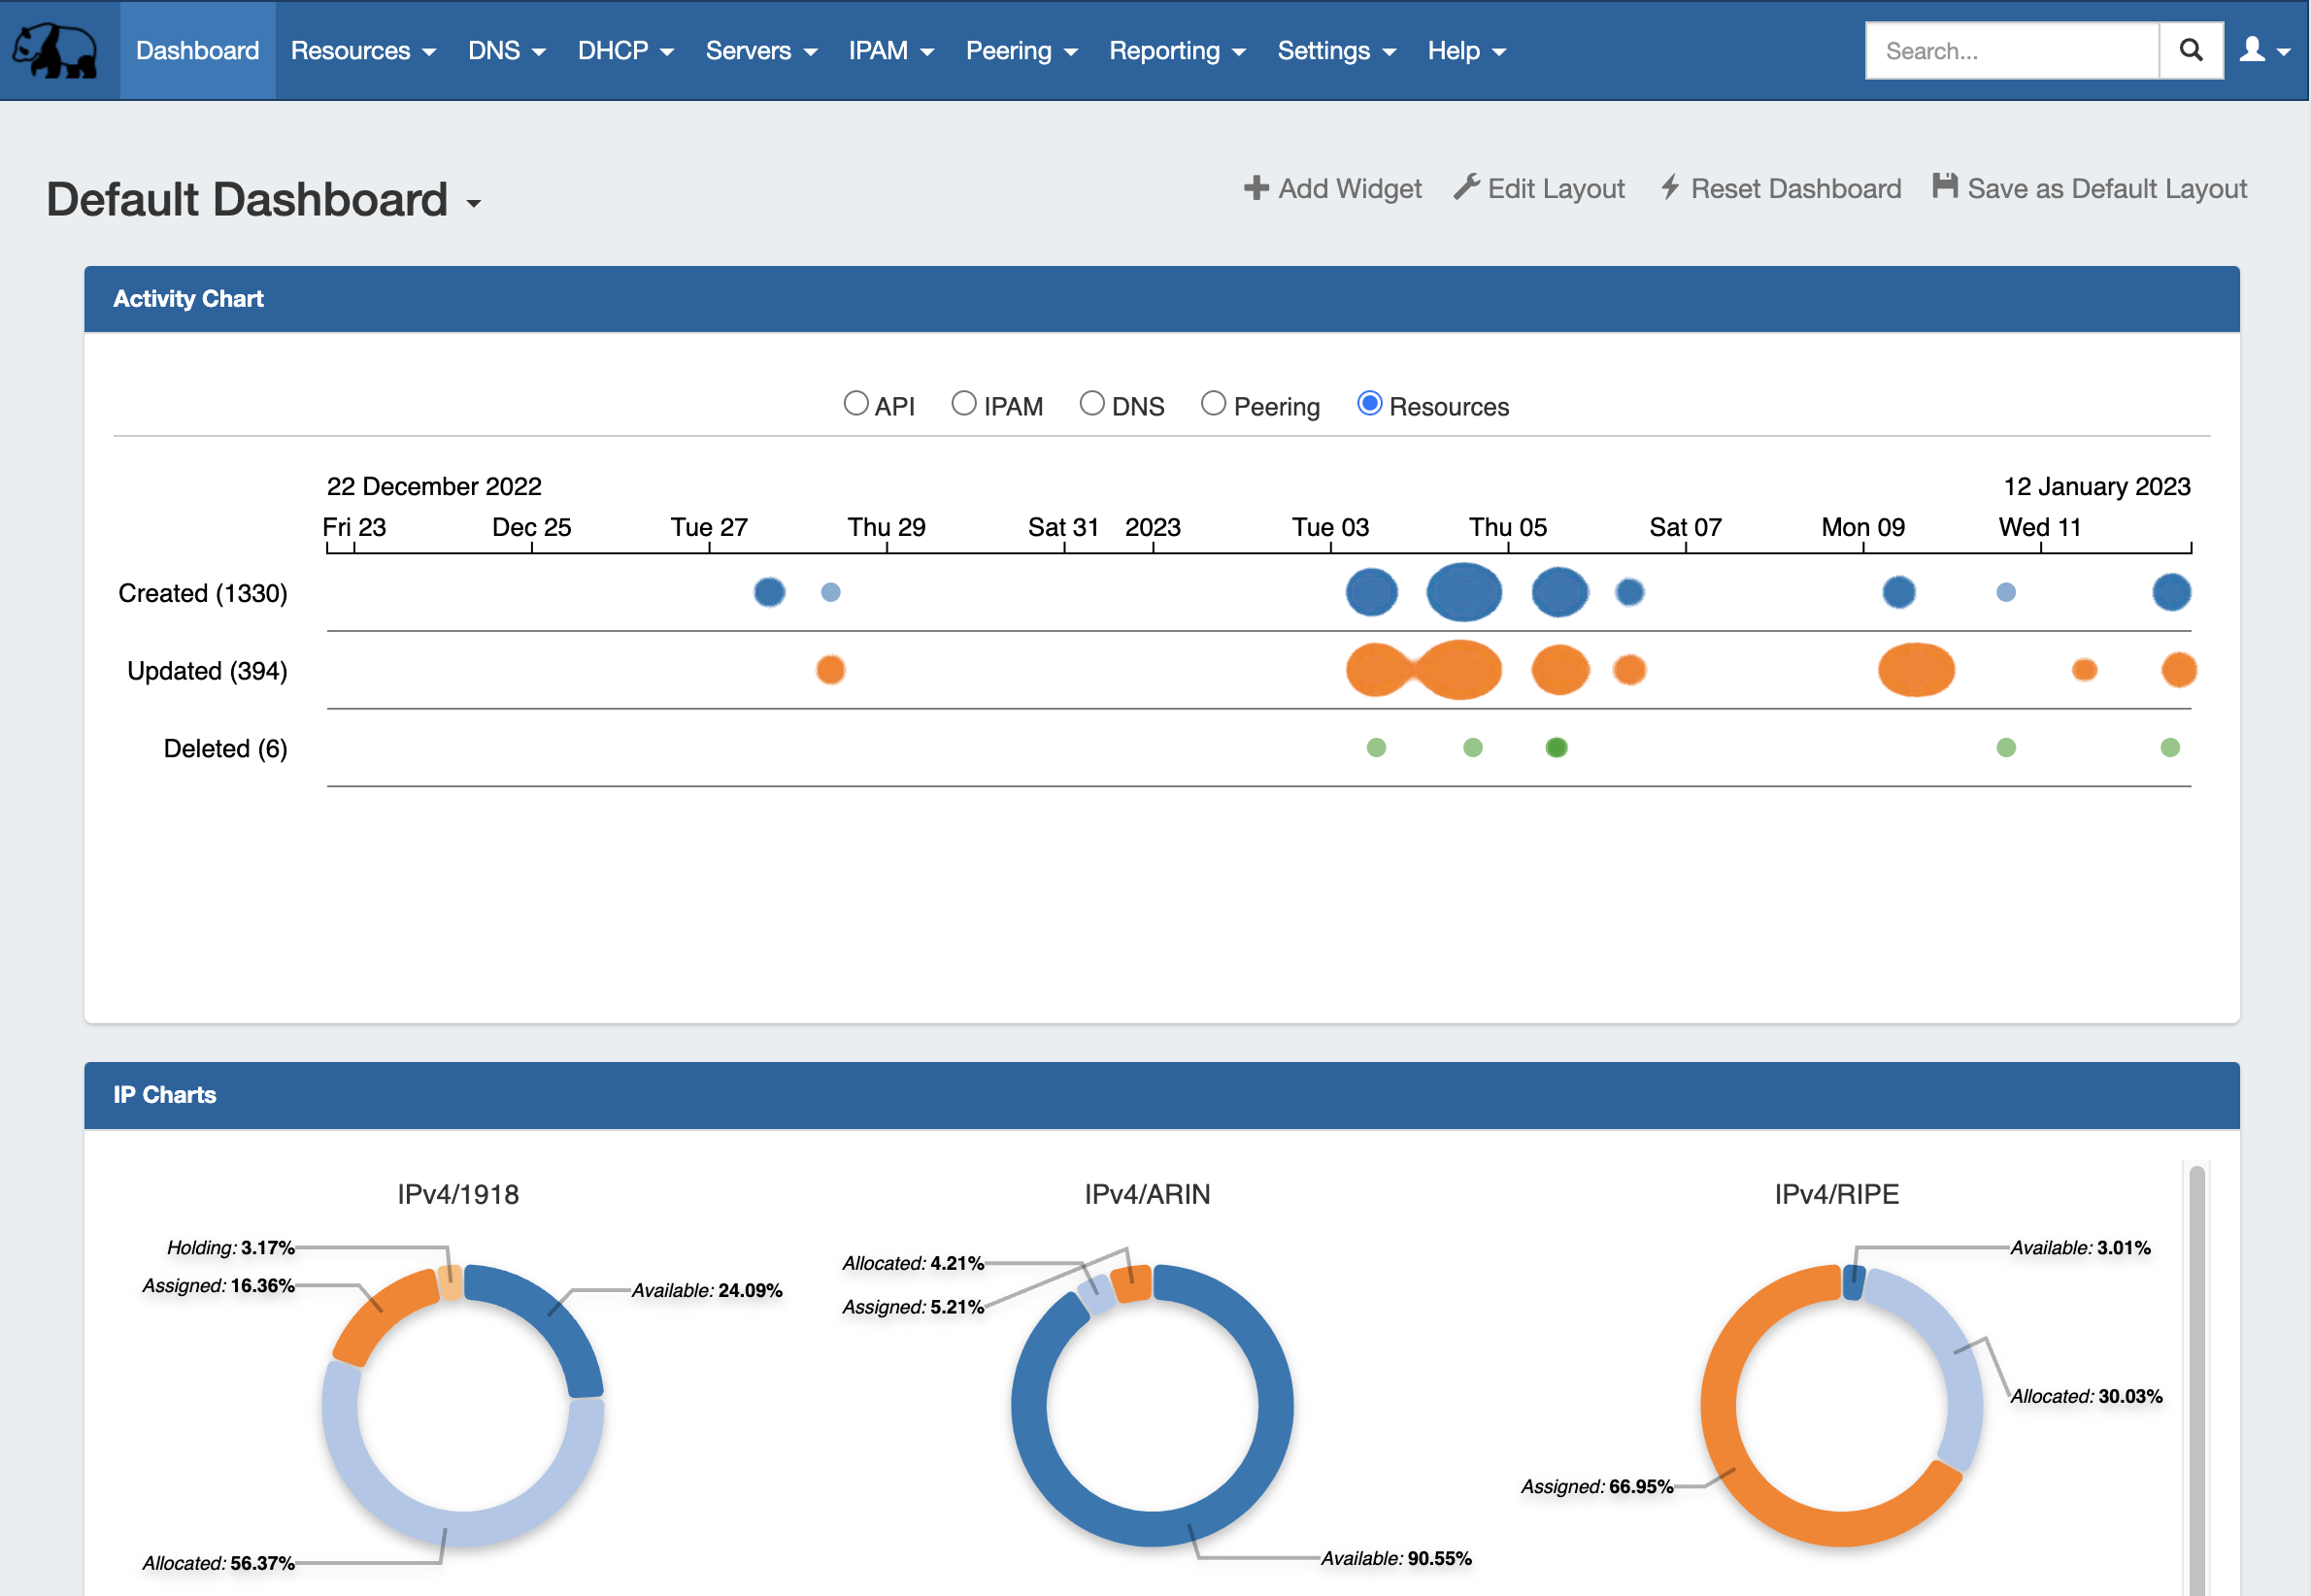
Default Dashboard Overview:
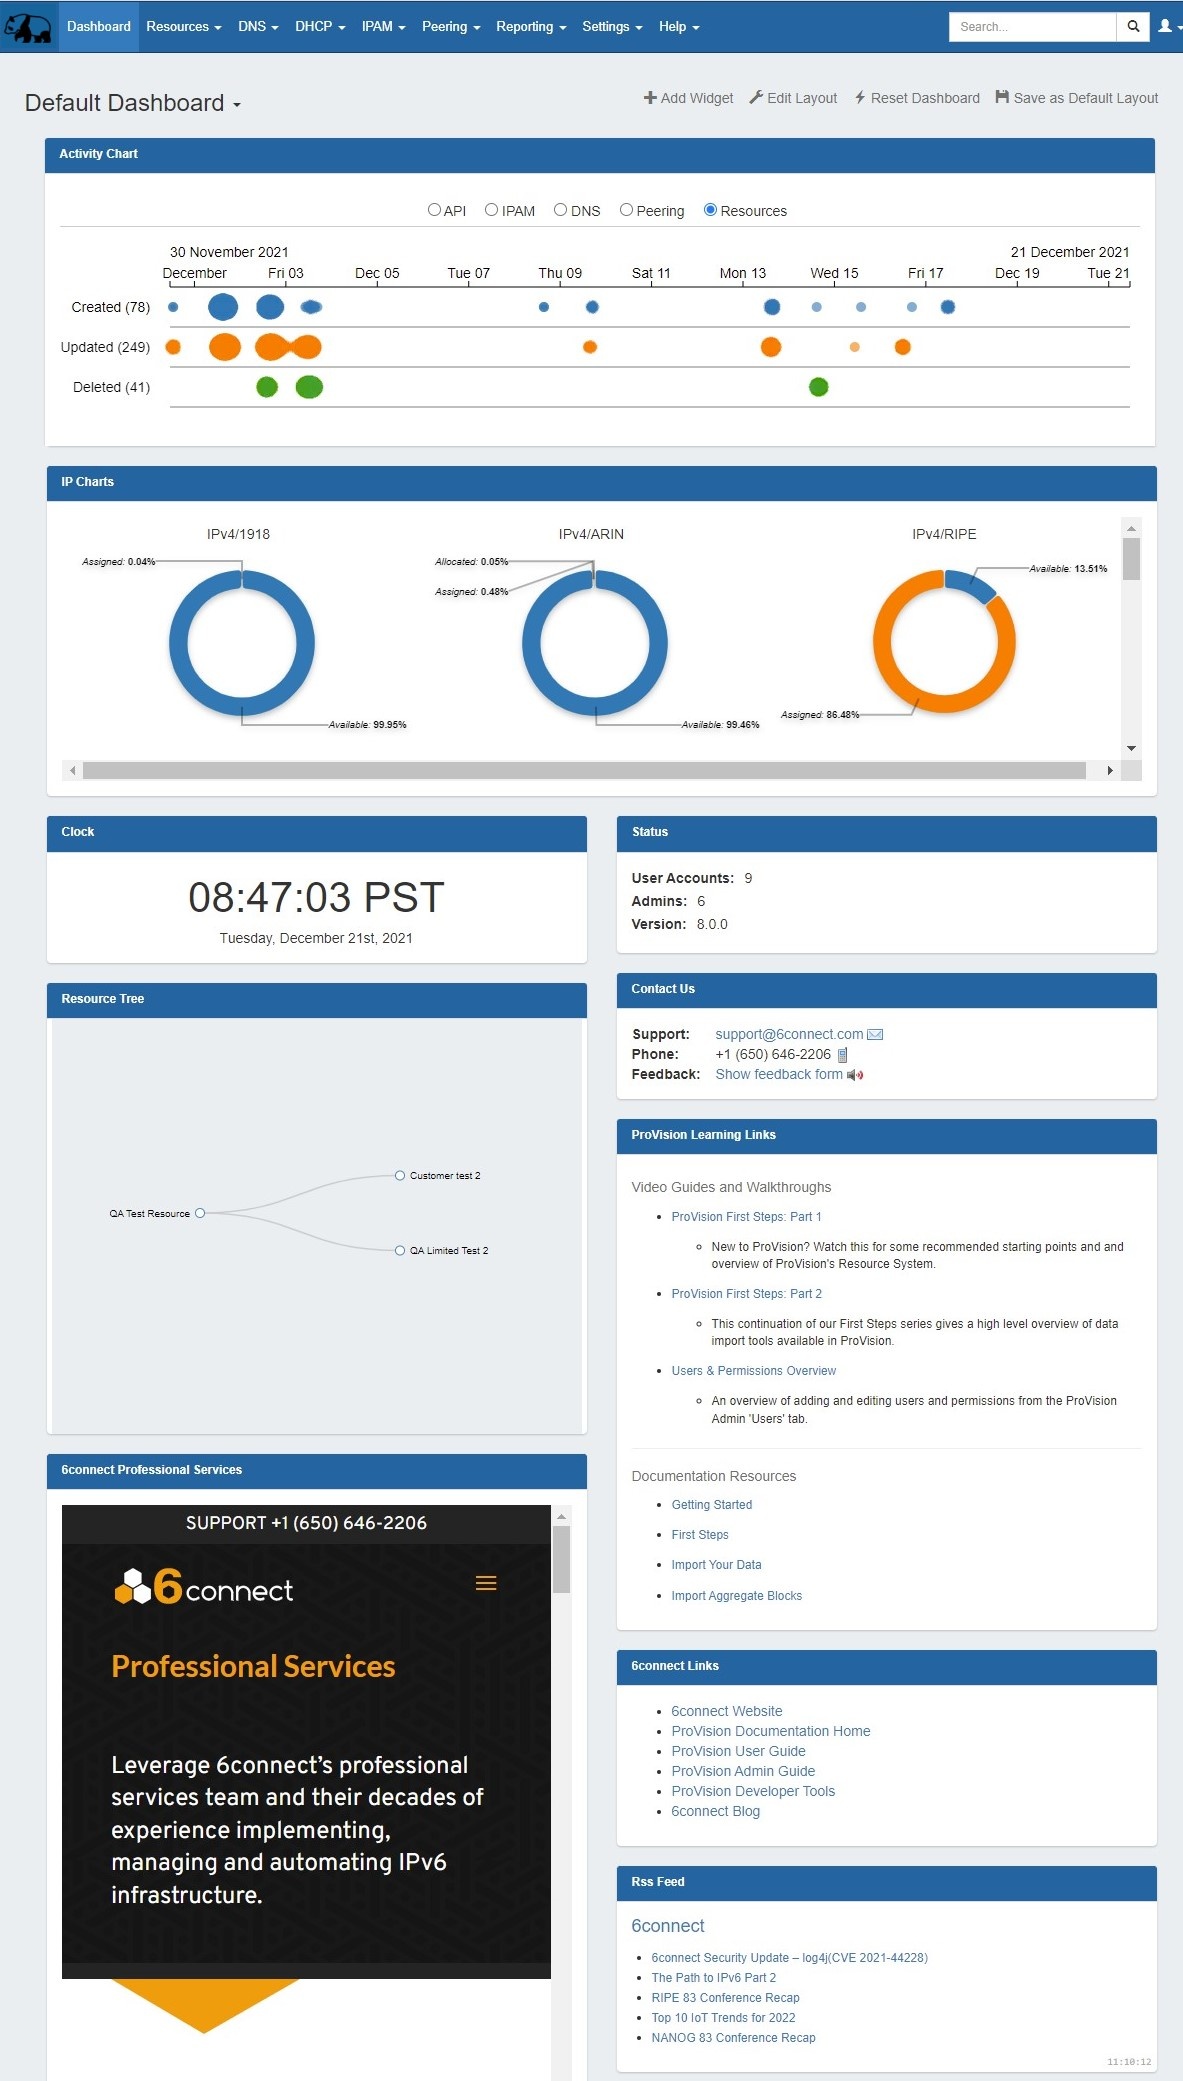
Although each user may have access to or create wildly differing dashboards, below are descriptions of the Widgets shown on the Default Dashboard (from left to right):
Contact Us:
IP Assignments:Bar charts illustrating the top 5 Resources that have the most assignments, with the % being the number of assignments for that resource over the total available IPs available in ProVision (that are viewable by the user).
Help and Support:
Handy links to commonly referenced documentation sections.
Zone Charts:
Pie charts of Zones with/without DNSSEC, and Zones with/without servers.
Resource Zone Assignments:
Bar charts illustrating the top 5 Zones that have the most assignments, with the % being the number of assignments for that Zone over the total available in ProVision (that are viewable by the user).
Tree:
An interactive horizontal or vertical treeview of a selected Resource and its children. Select a top-level resource from the Widget's Edit menu. Users may click and drag to move within the Widget, as well as zoom in and out using a scroll wheel. Clicking on filled dots will expand the tree to show the children of that resource. Double-clicking on a resource in the tree will give you the option to navigate to the resource's entry page.
Multiple Resource Tree Widgets may exist on a dashboard.
Contact Us:
Provides support email, phone, and feedback form information. Support phone number and email address are set from the ProVision Admin settings. The feedback form email address is editable within the Widget.
Only one Contact Us Widget may exist on a dashboard.
Learning Links: (Markdown Widget)
Pre-created Markdown Widget containing links to commonly referenced ProVision documentation sections, video guides, and walkthroughs.
The Markdown Widget is a blank slate where users may add links, text, or other content through use of the Markdown language.
Multiple Markdown Widgets may exist on a dashboard.
Professional Services: (iFrame Widget)
Pre-created iFrame Widget accessing the Professional Services website.
The iFrame Widget sets a https URL to be viewed in an iFrame, to view stats or commonly referenced websites.
Multiple iFrame Widgets may exist on a dashboard.
Documentation Links (Links Widget):
Pre-created Links Widget listing company resources and documentation links.
Link URL and display may be set from within the Widget.
Multiple Links Widgets may exist on a dashboard.
RSS (RSS Feed Widget):
Pre-created RSS Feed Widget accessing the 6connect Blog RSS.
Shows the most recent five entries of a selected https RSS Feed. Feed links open in a new window when clicked.
Multiple RSS Feed Widgets may exist on a dashboard.
Additional Information
Continue on for details on dashboard customization, as well as how to add, move, update, and delete individual Widgets.
