Log
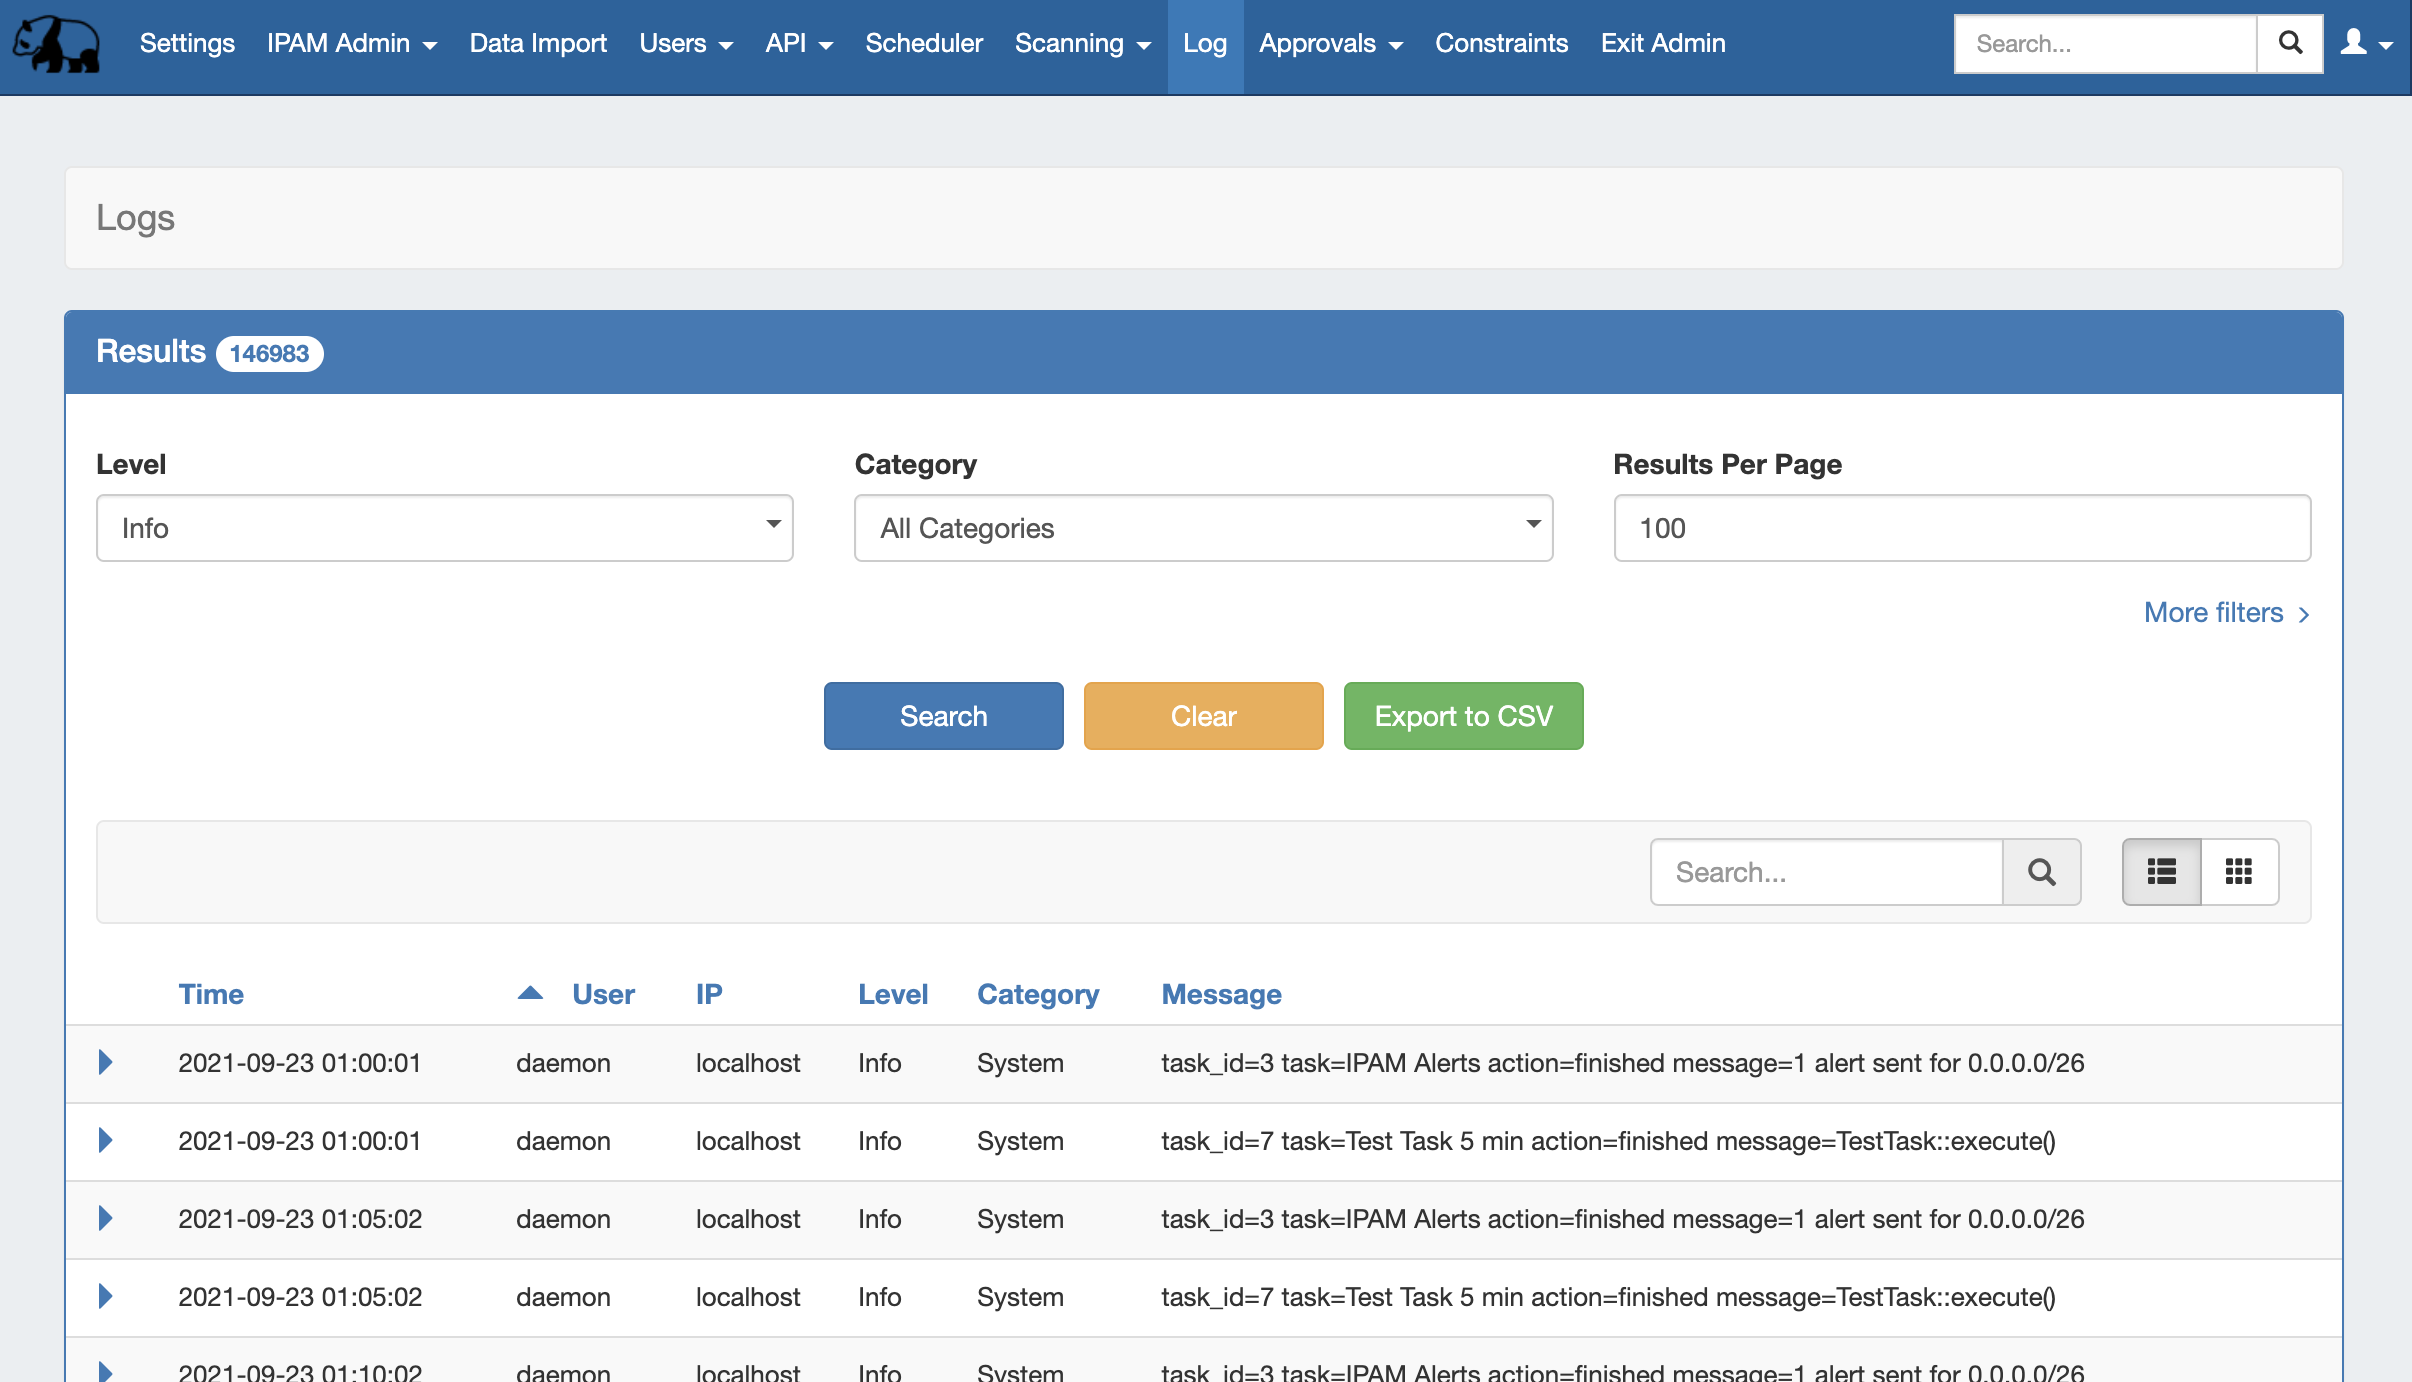
The 6connect ProVision log provides detailed information on actions performed in ProVision. The Log is only available to Admin users.
...
Filters and search options:
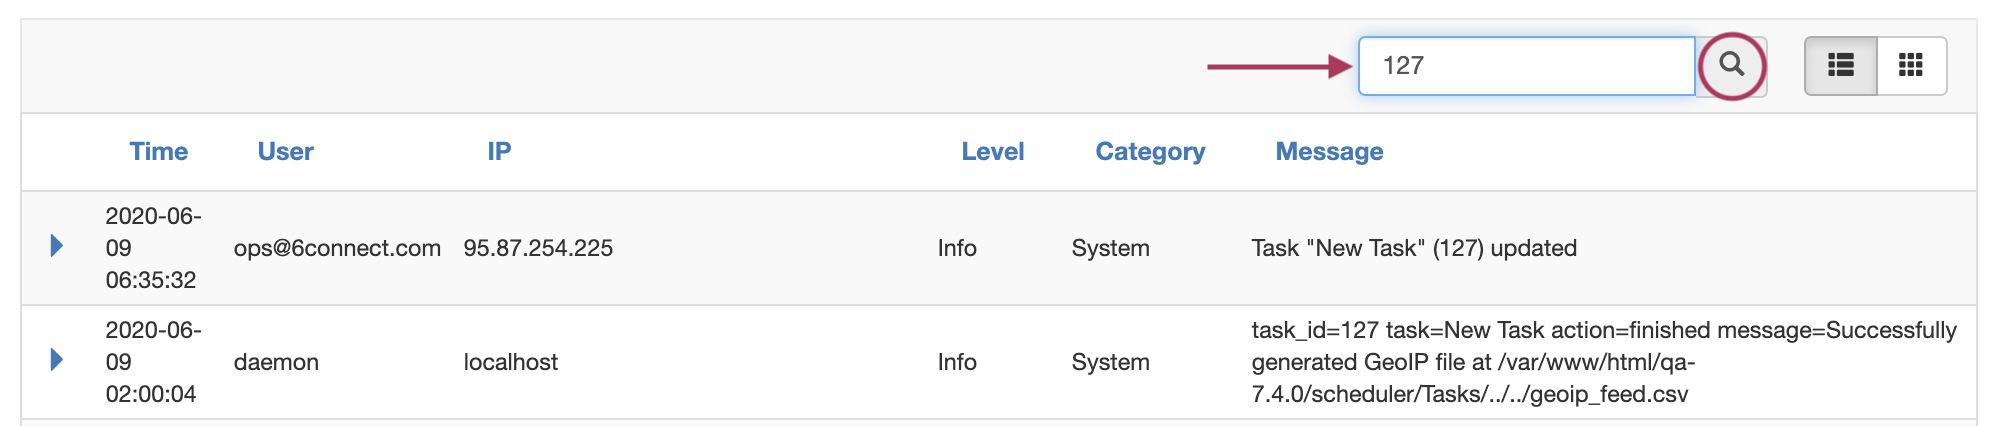
Search or filter by a specific keyword by entering the term into the search box in the top right of the results list. Search terms may be usernames, resource names, task names, resource or task id numbers, IP's, and so on. Clear the search by clicking the "x" in the search box.
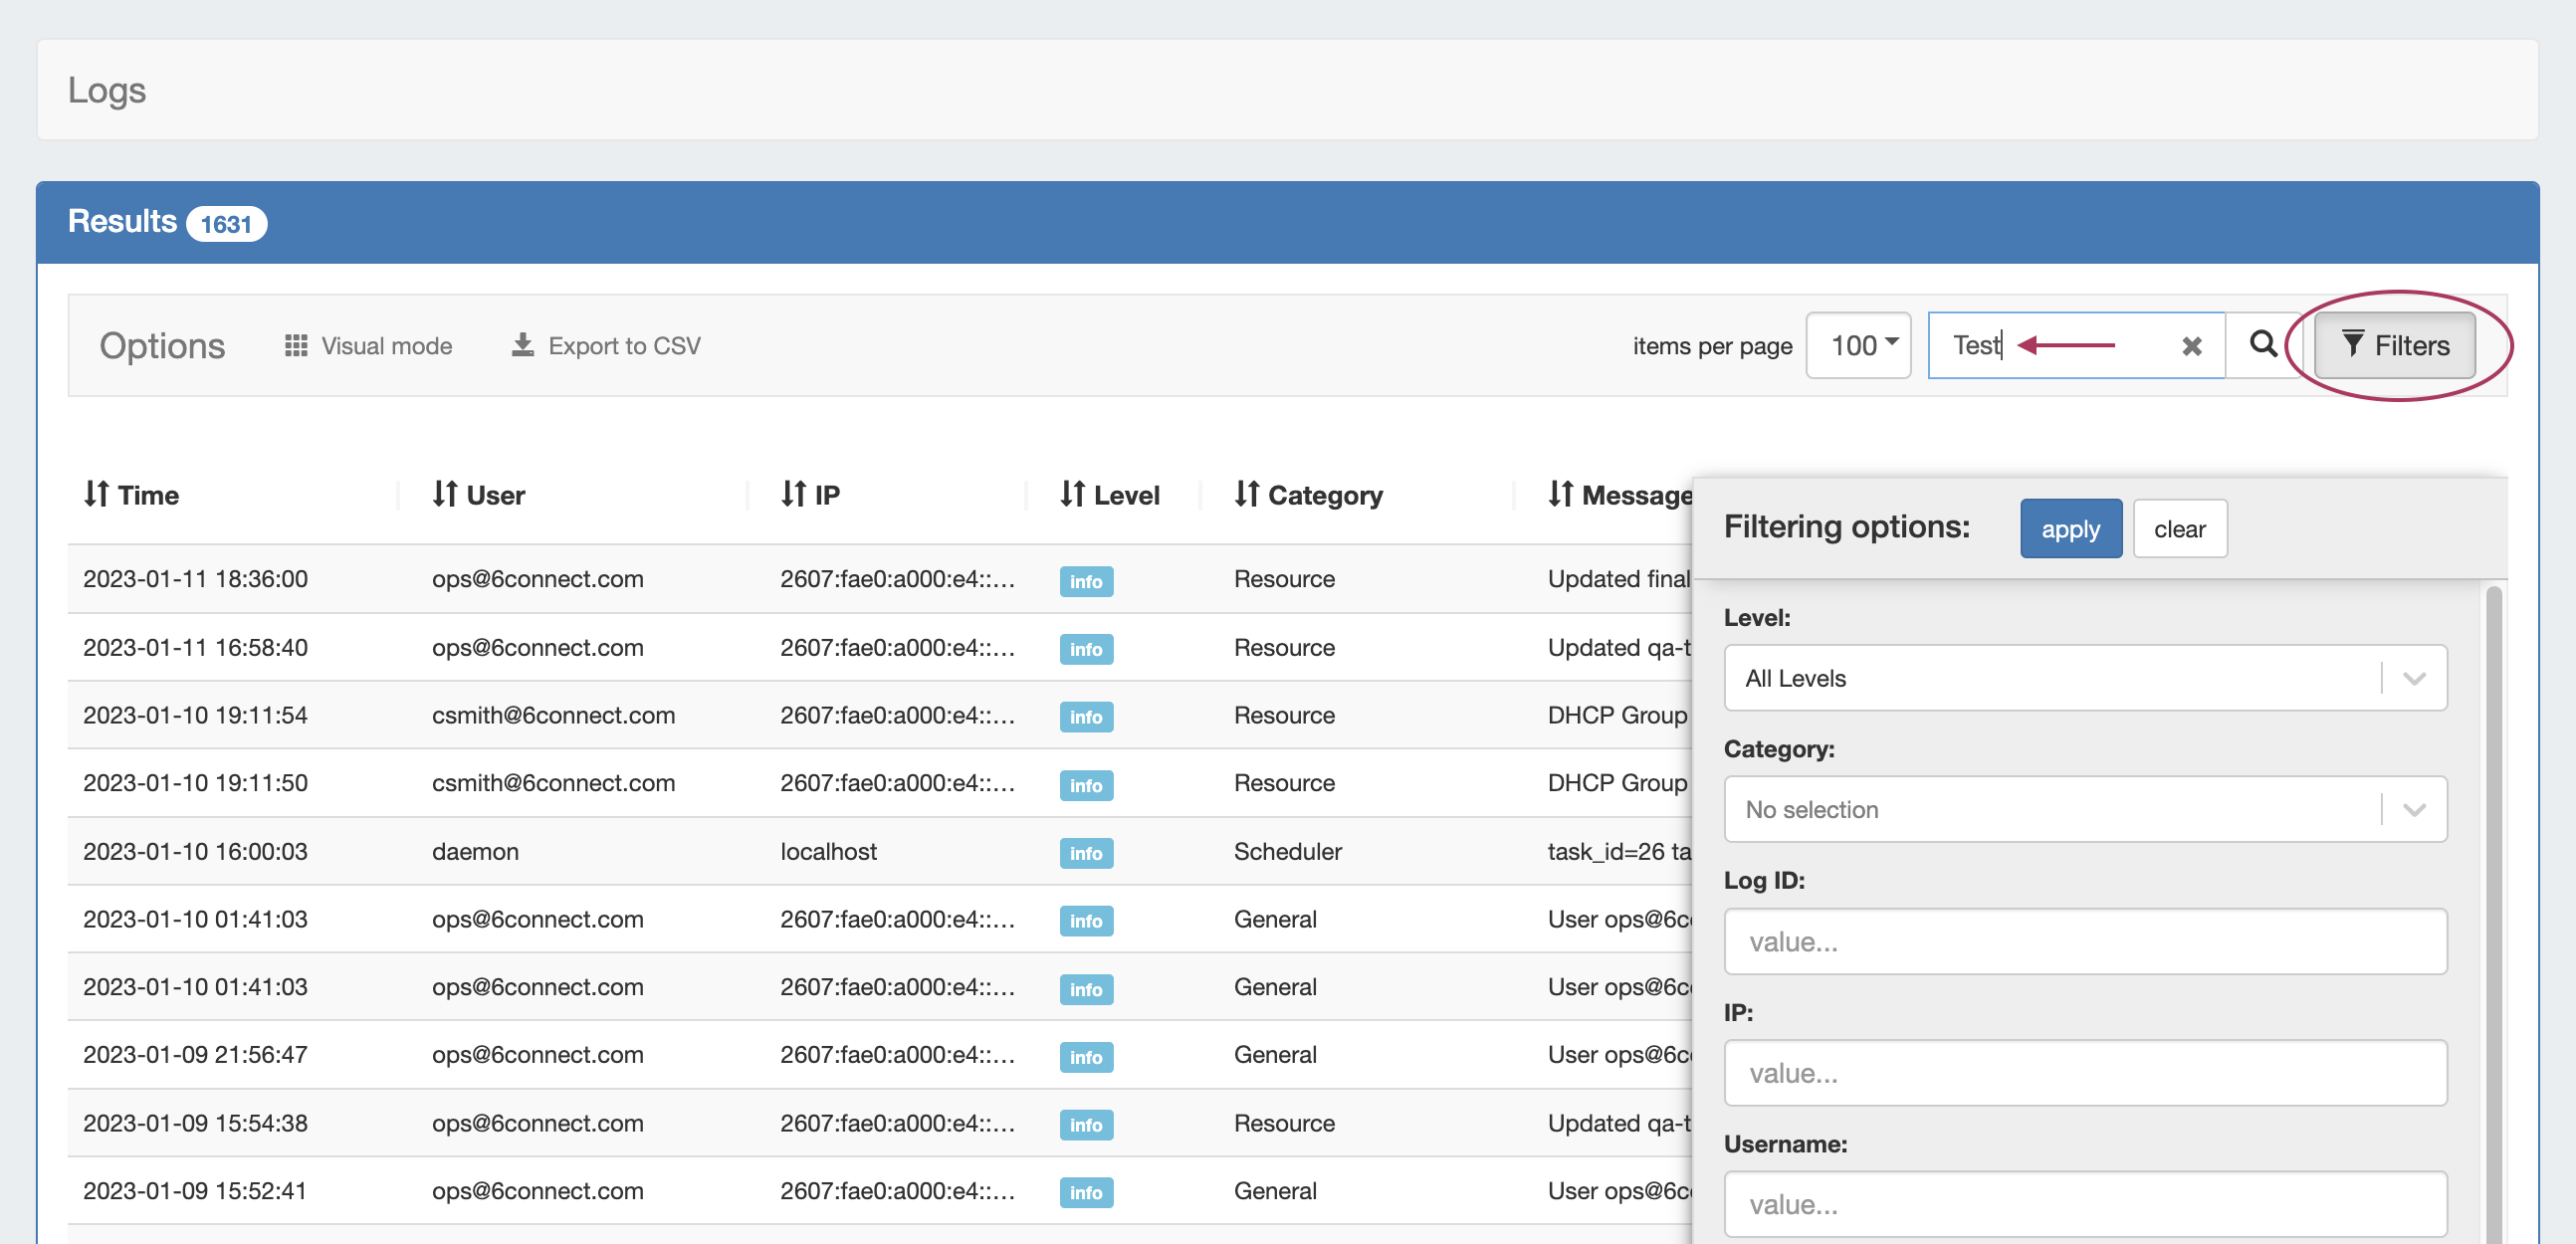
Filter the log list by selecting (or typing) clicking "Filters" (also at top right), then selecting or entering the desired filter value at the top of the Log pageinto the filter flyout, then click on the "SearchApply" button.
Additional options are made visible by clicking on the "More Filters" link below "Results per page".
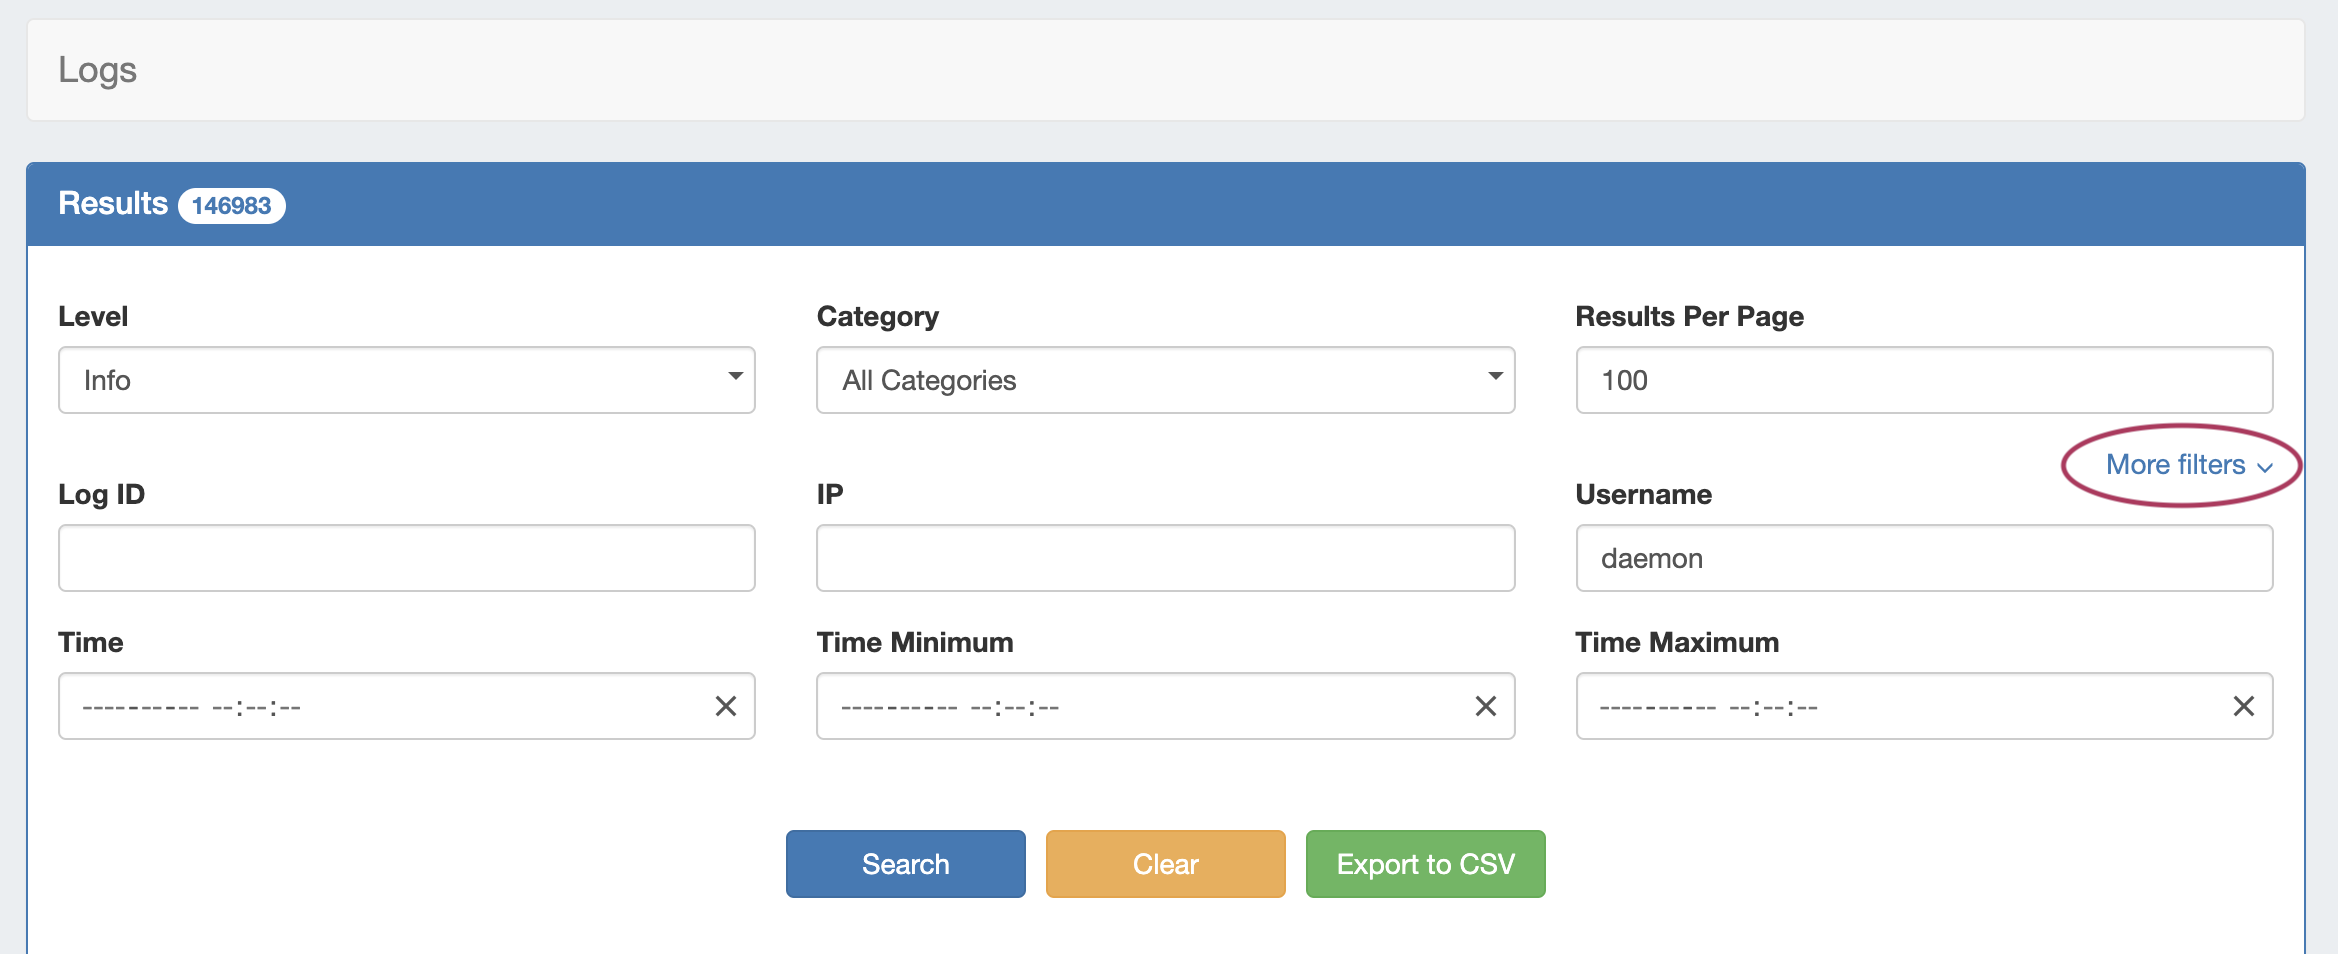
To clear active filters, open the filter flyout and click "clear".
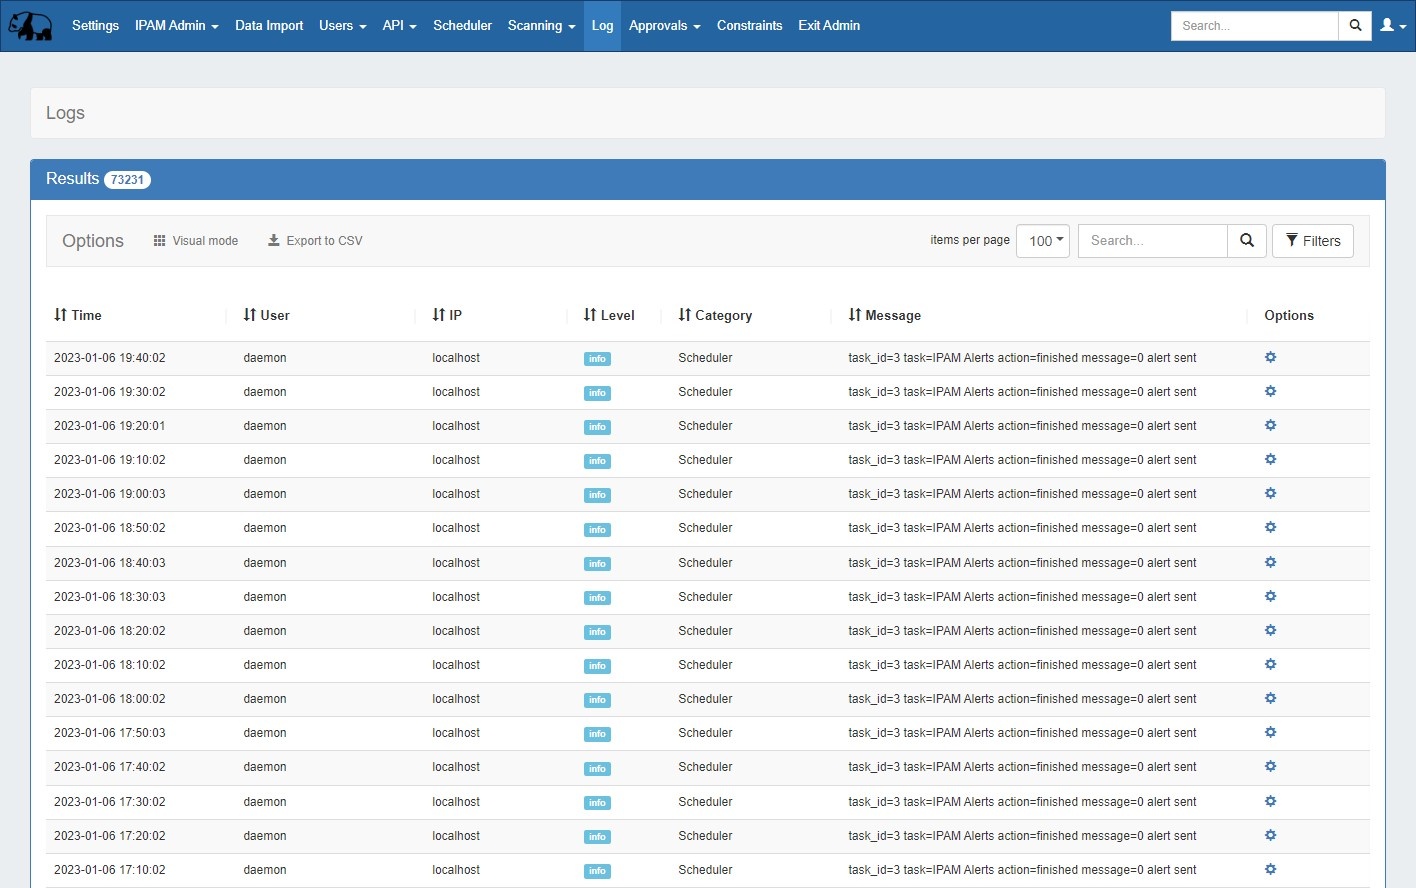
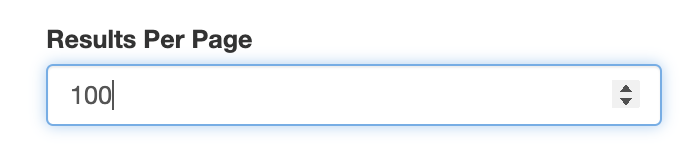
You may also change the number of log entries per page by selecting an option next to "Items per page" at the top right of the results list. By default, this value is set to 100.
Filtering Options:
The following filter The following filters and options are available:Primary Filters
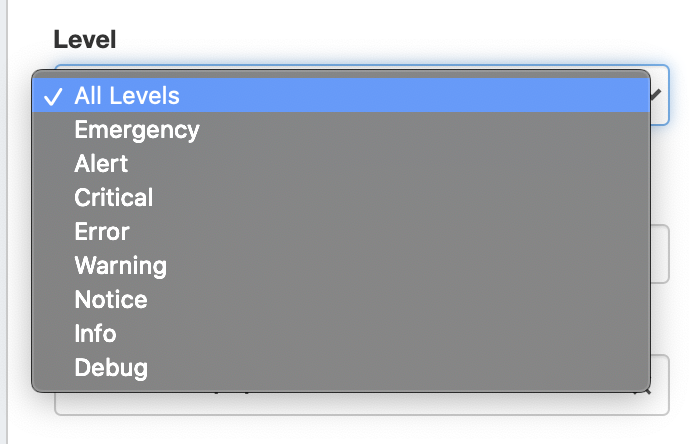
- Level:
...
- Available Level filters include:
...
- "All Levels", "Emergency", "Alert", "Critical", "Error", "Warning", "Notice", "Info", or "Debug".
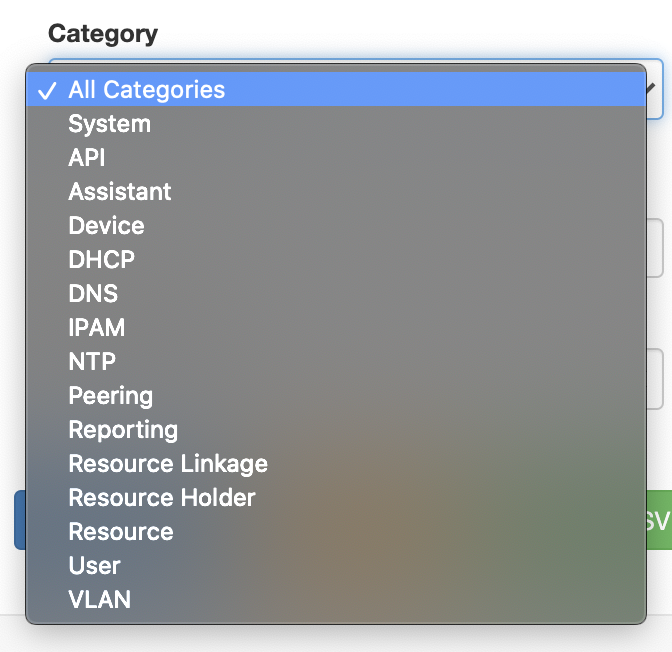
- Category:
...
- You may select one or more category filters. Available category filters include: "API" , "Assistant",
...
- "Device", "DHCP", "DNS", "IPAM", "NTP", "Peering", "Reporting", "Resource Linkage", "Resource Holder", Resource", "
...
- Scheduler",
...
Results per page: In the "Results per page" text box, type the desired number of log entries to see per page. By default, this value is set to 100.
Search: Type a search string, then click the "Search" button. Search terms may be usernames, resource names, task names, resource or task id numbers, IP's, and so on.
More Options:
...
- "System", "User", or "VLAN".
- Log ID: Retrieve a specific log entry from its log_id parameter.
- IP: Search by IP of the machine that created the event in the log.
- Username: Filter logs by ProVision username, or by "Unknown" user.
- Time: Filter log entries by exact time created. Must be in datetime format (2016-08-14 16:41:18).
- Time Minimum: The earliest day and time of log entries to show in results. Must be in datetime format (2016-08-14 16:41:18).
- Time Maximum: The latest day and time of log entries to show in results. Must be in datetime format (2016-08-14 16:41:18).
...
| Tip | ||
|---|---|---|
| ||
Use "Time Minimum" and "Time Maximum" together to specify a specific date / time range, such as one 24 hour period: |
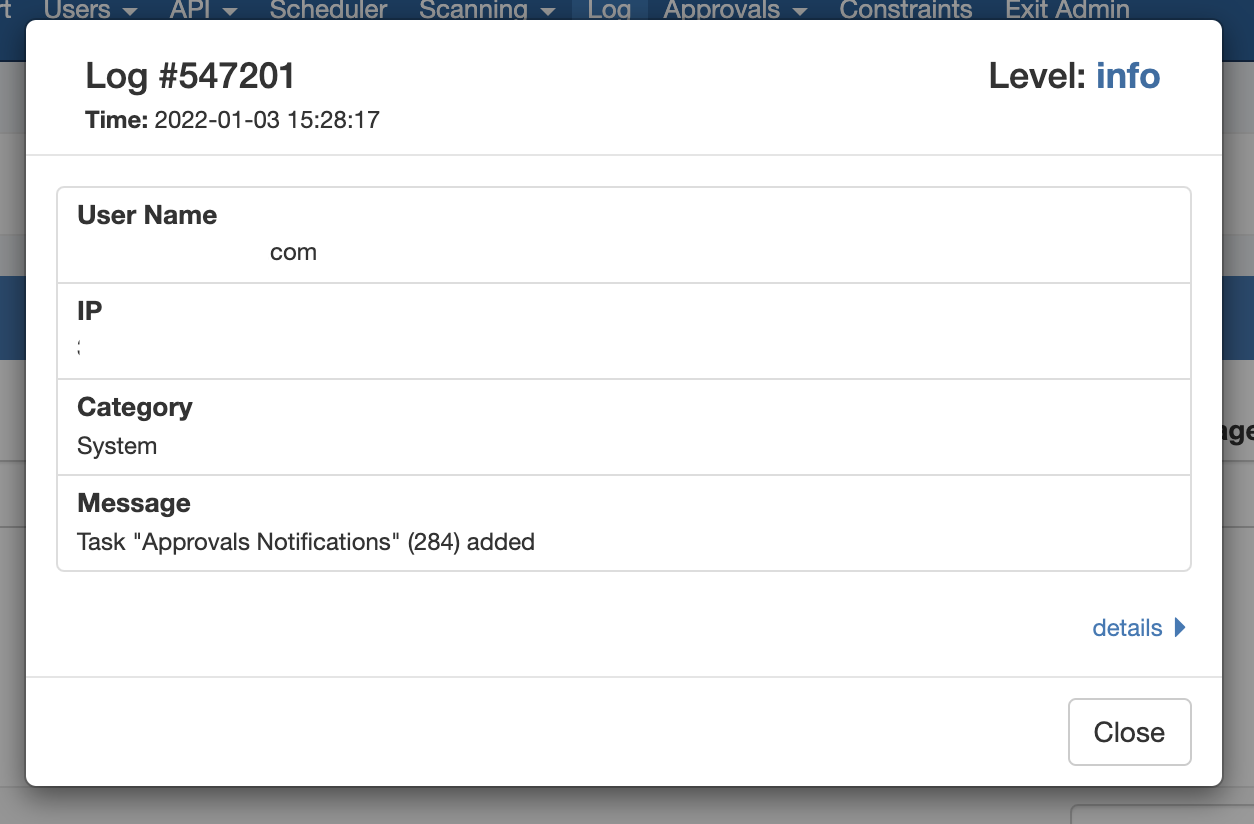
Log Details:
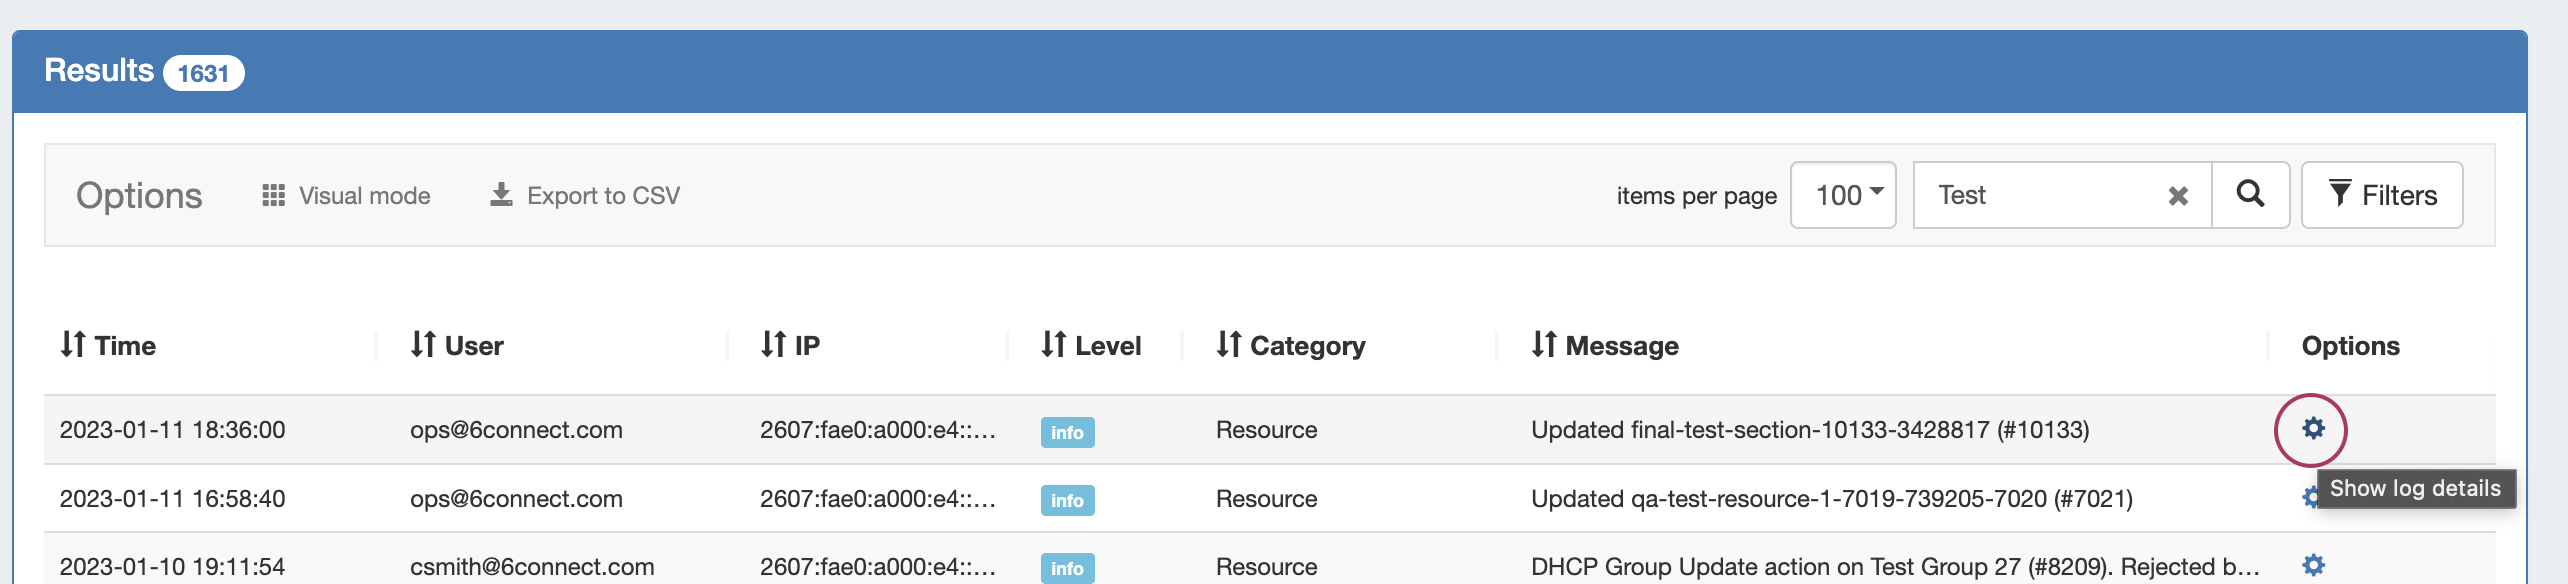
Clicking Click on the blue arrow on the left side of each log entry expands the entry to show gear icon for a log entry to display additional details pertaining to that entry.
General information on that log entry will display under the "Information" tab.
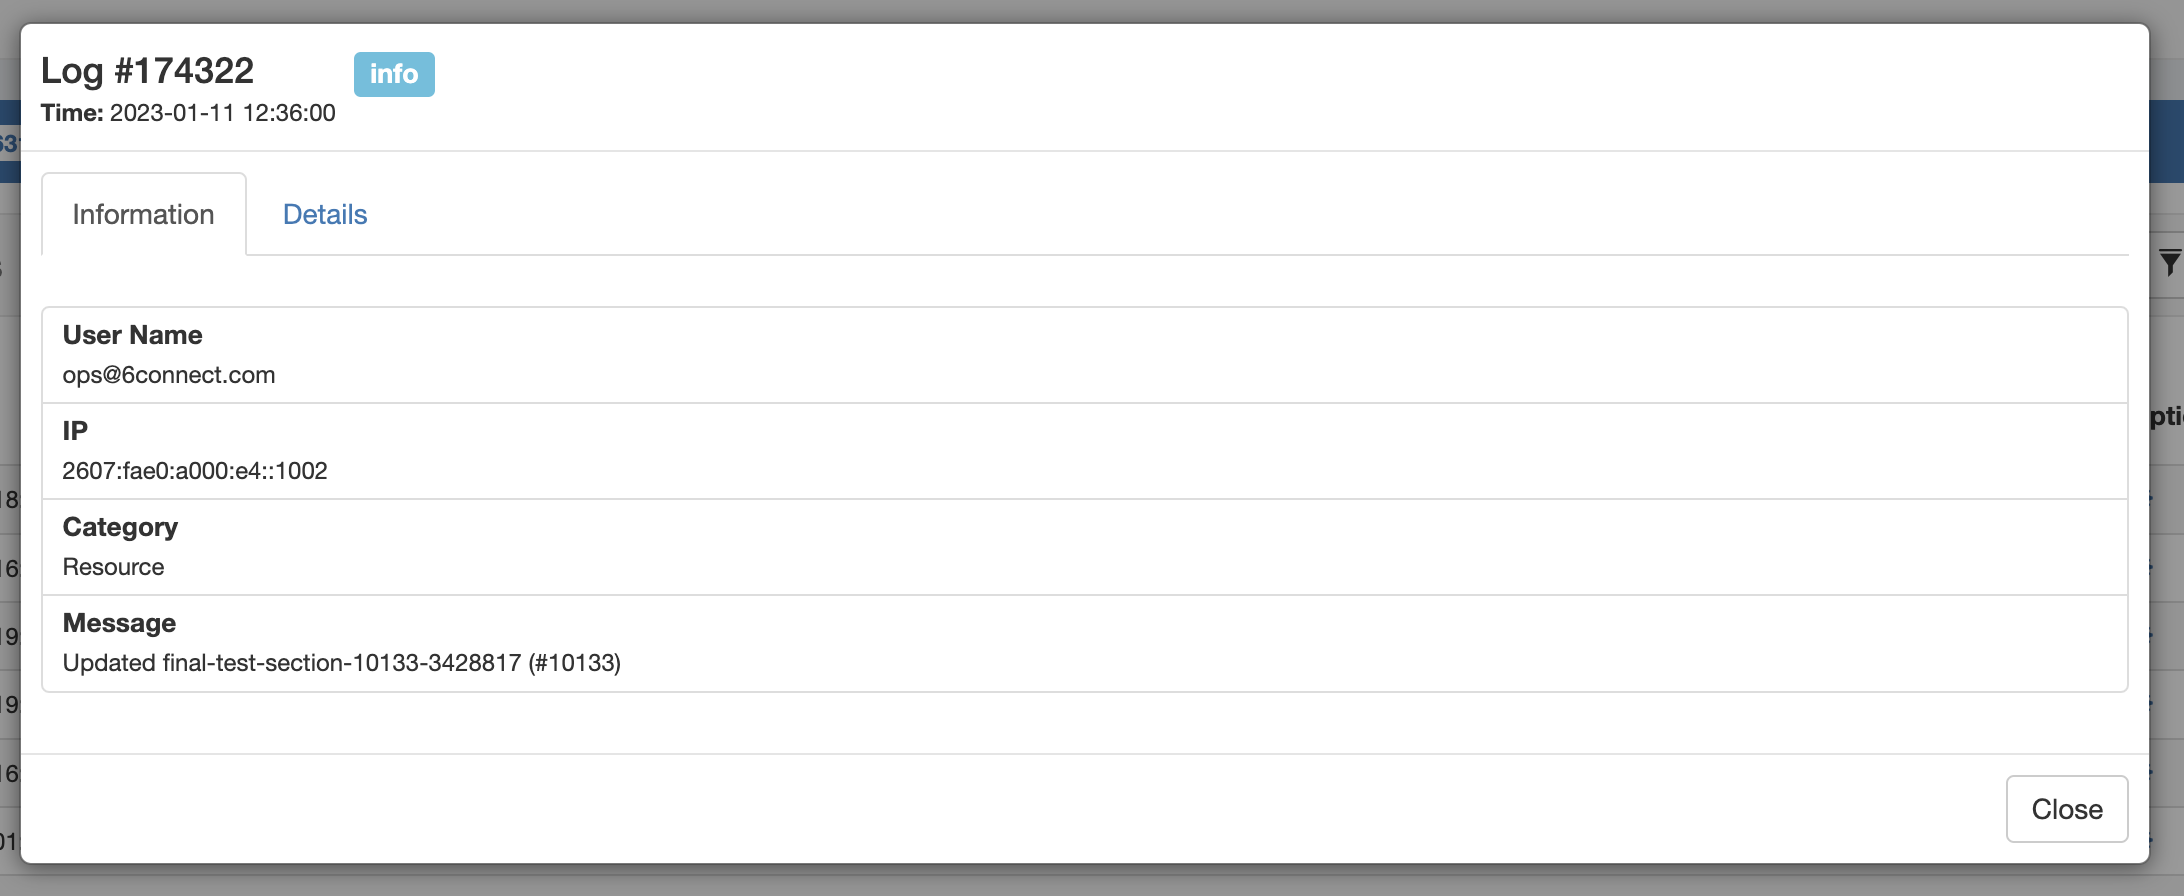 .
.
Click on the "Details" tab to view specific values pertaining to the log action.
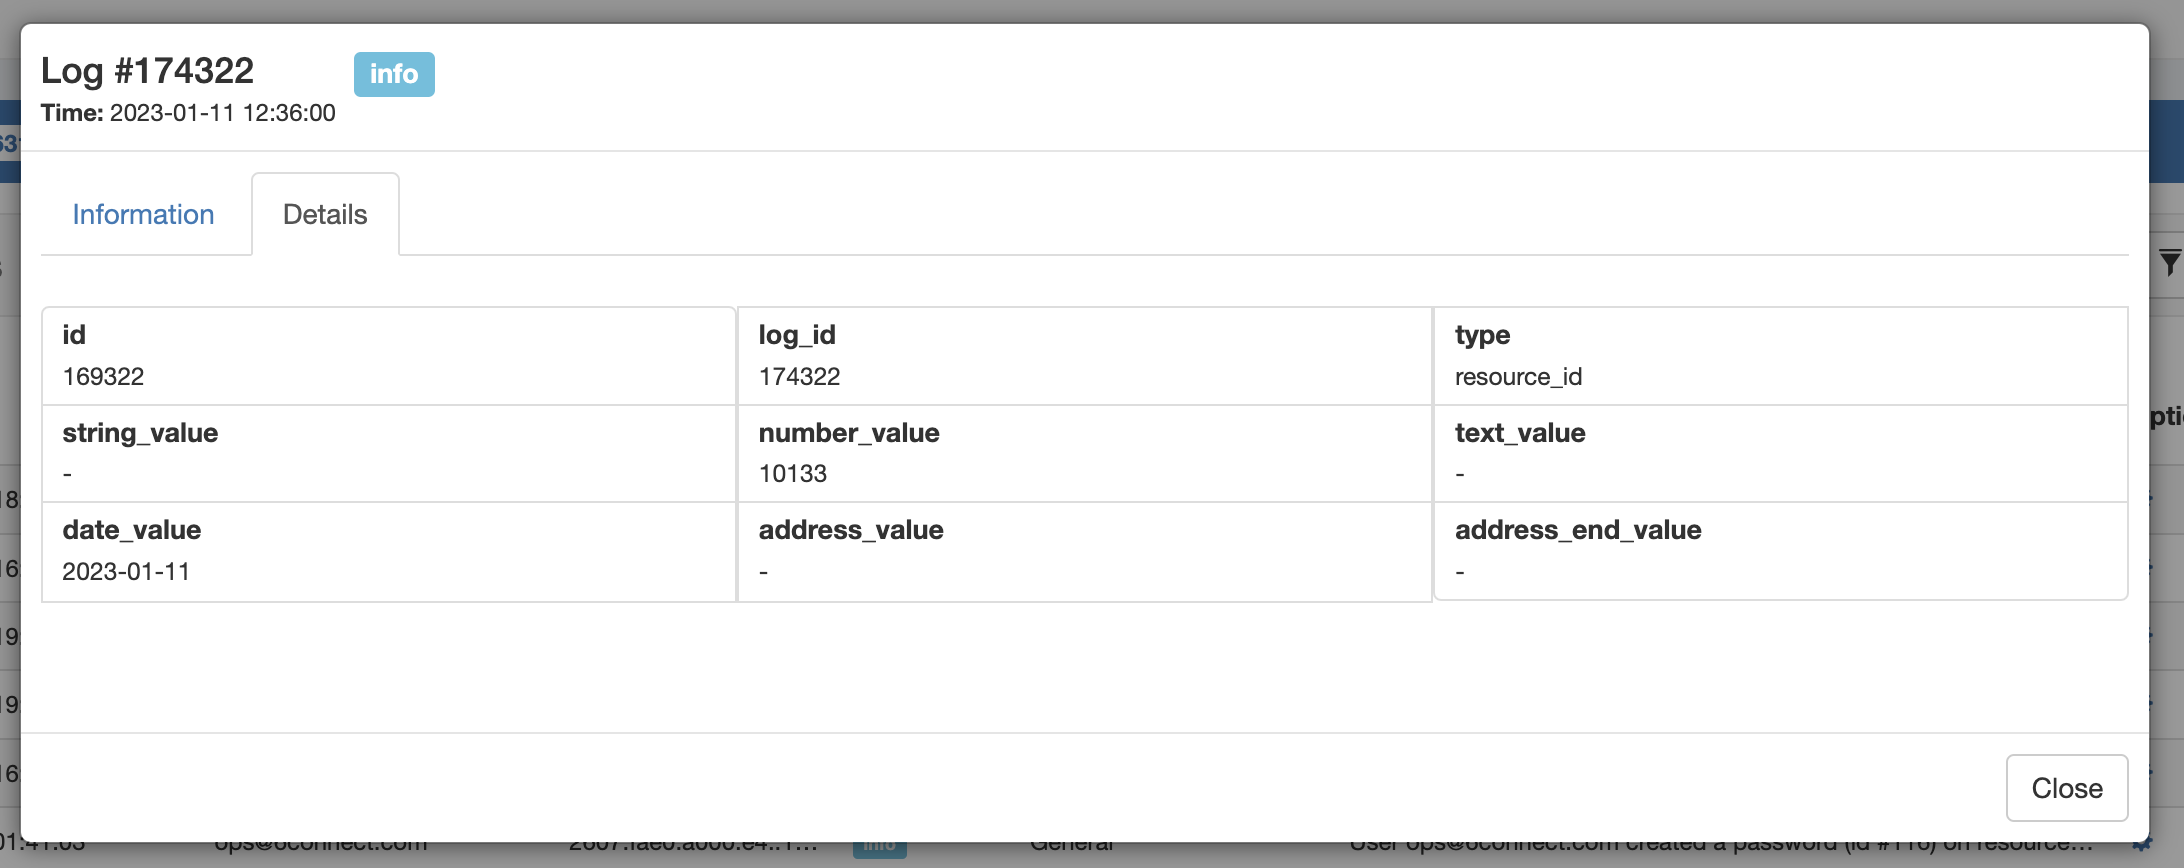
Note: Not all fields may be populated, and not all log types may have applicable details. 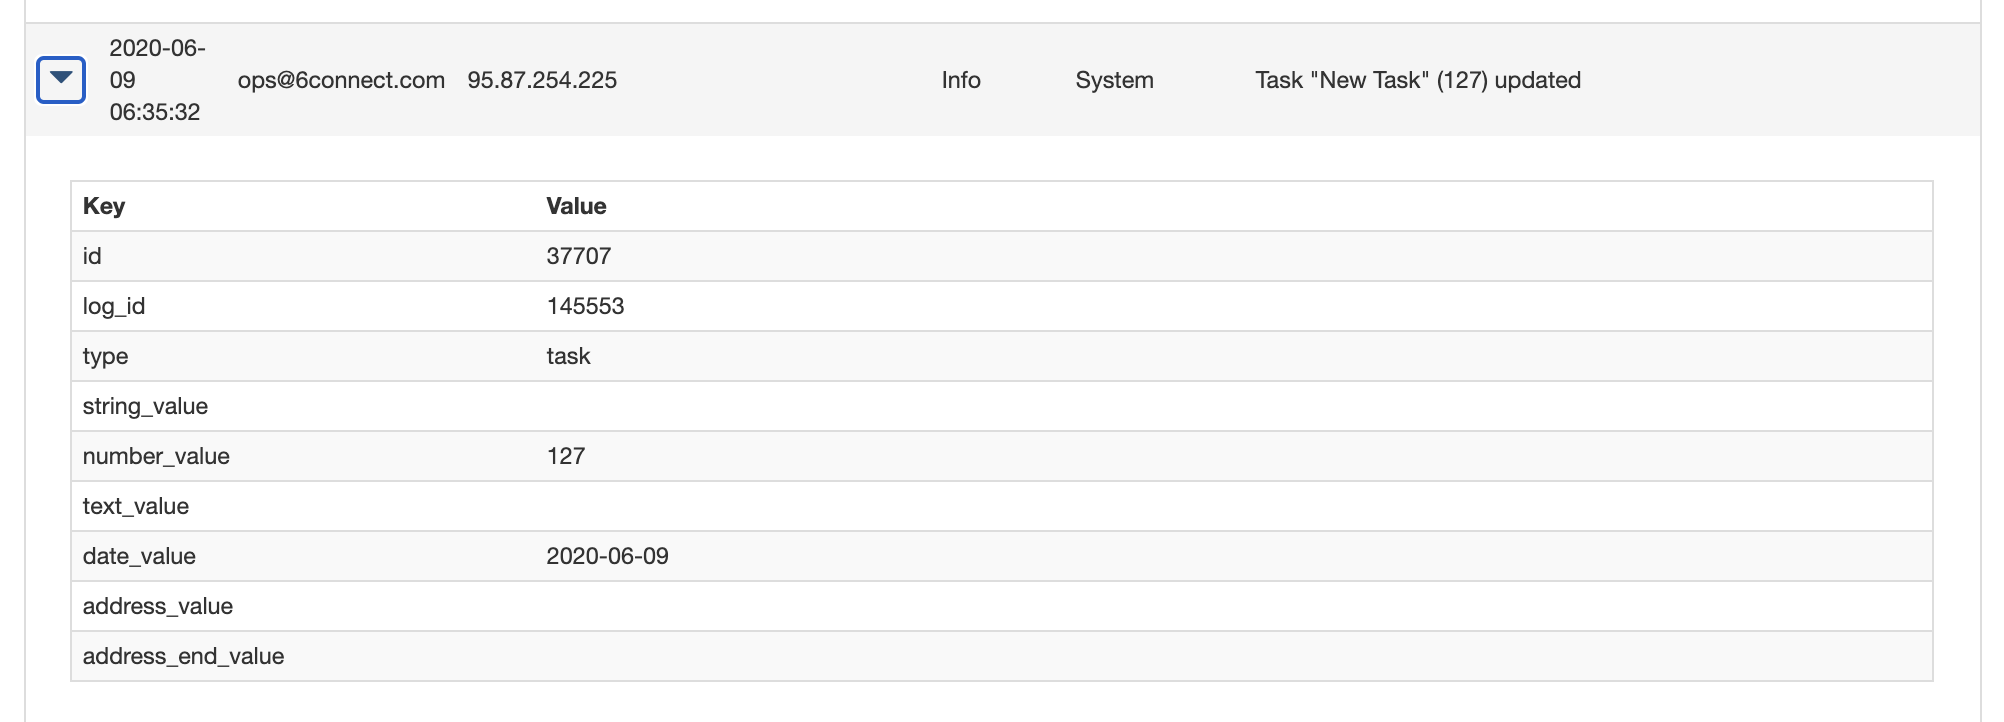
Detail fields may include:
...
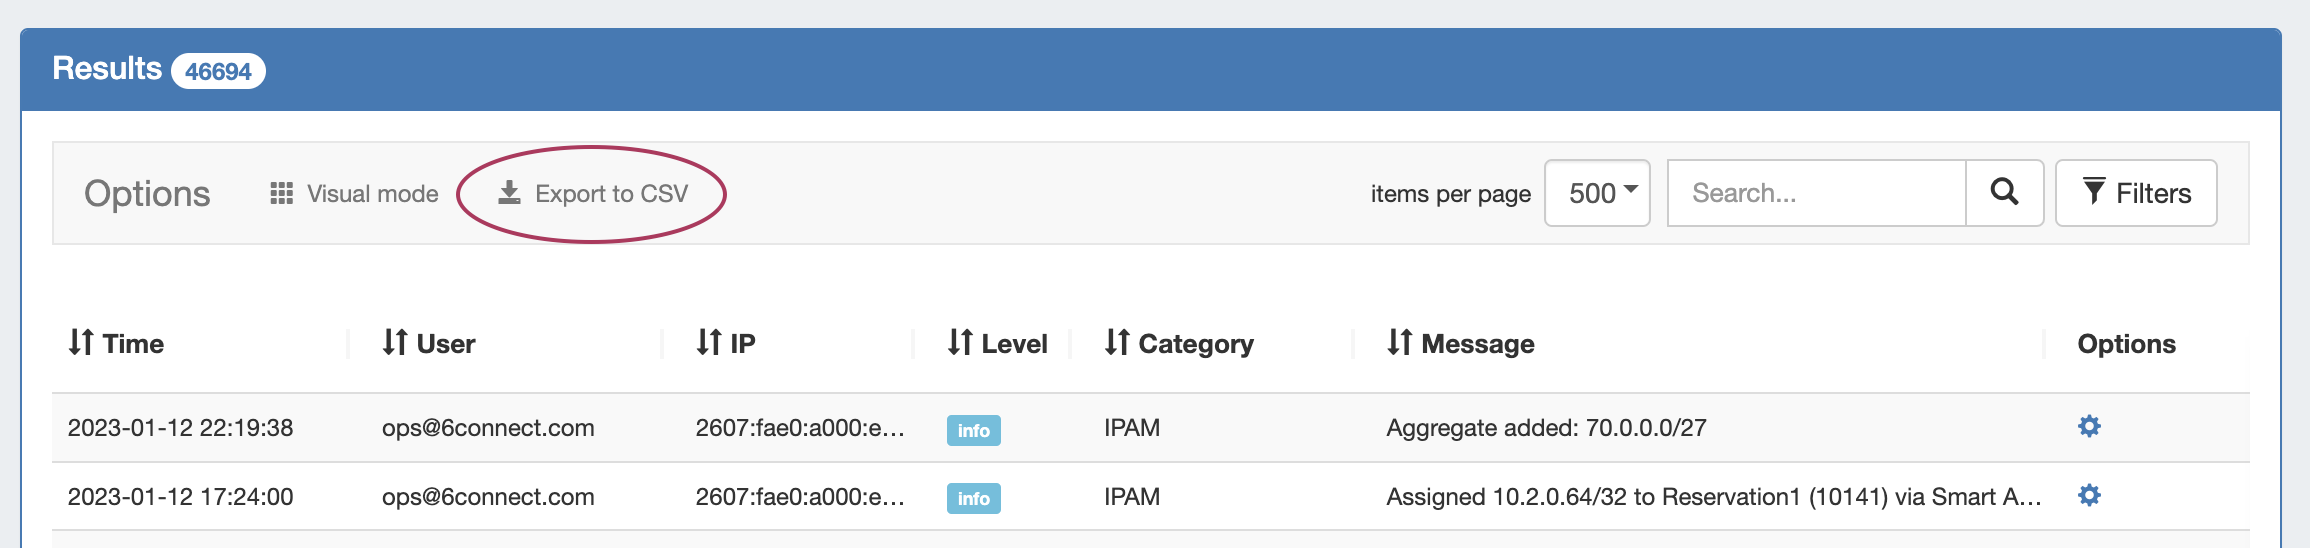
To view the graphical chart version of Logs, click the "chartVisual Mode" toggle on at the bottom right top of the search fieldsresults list.
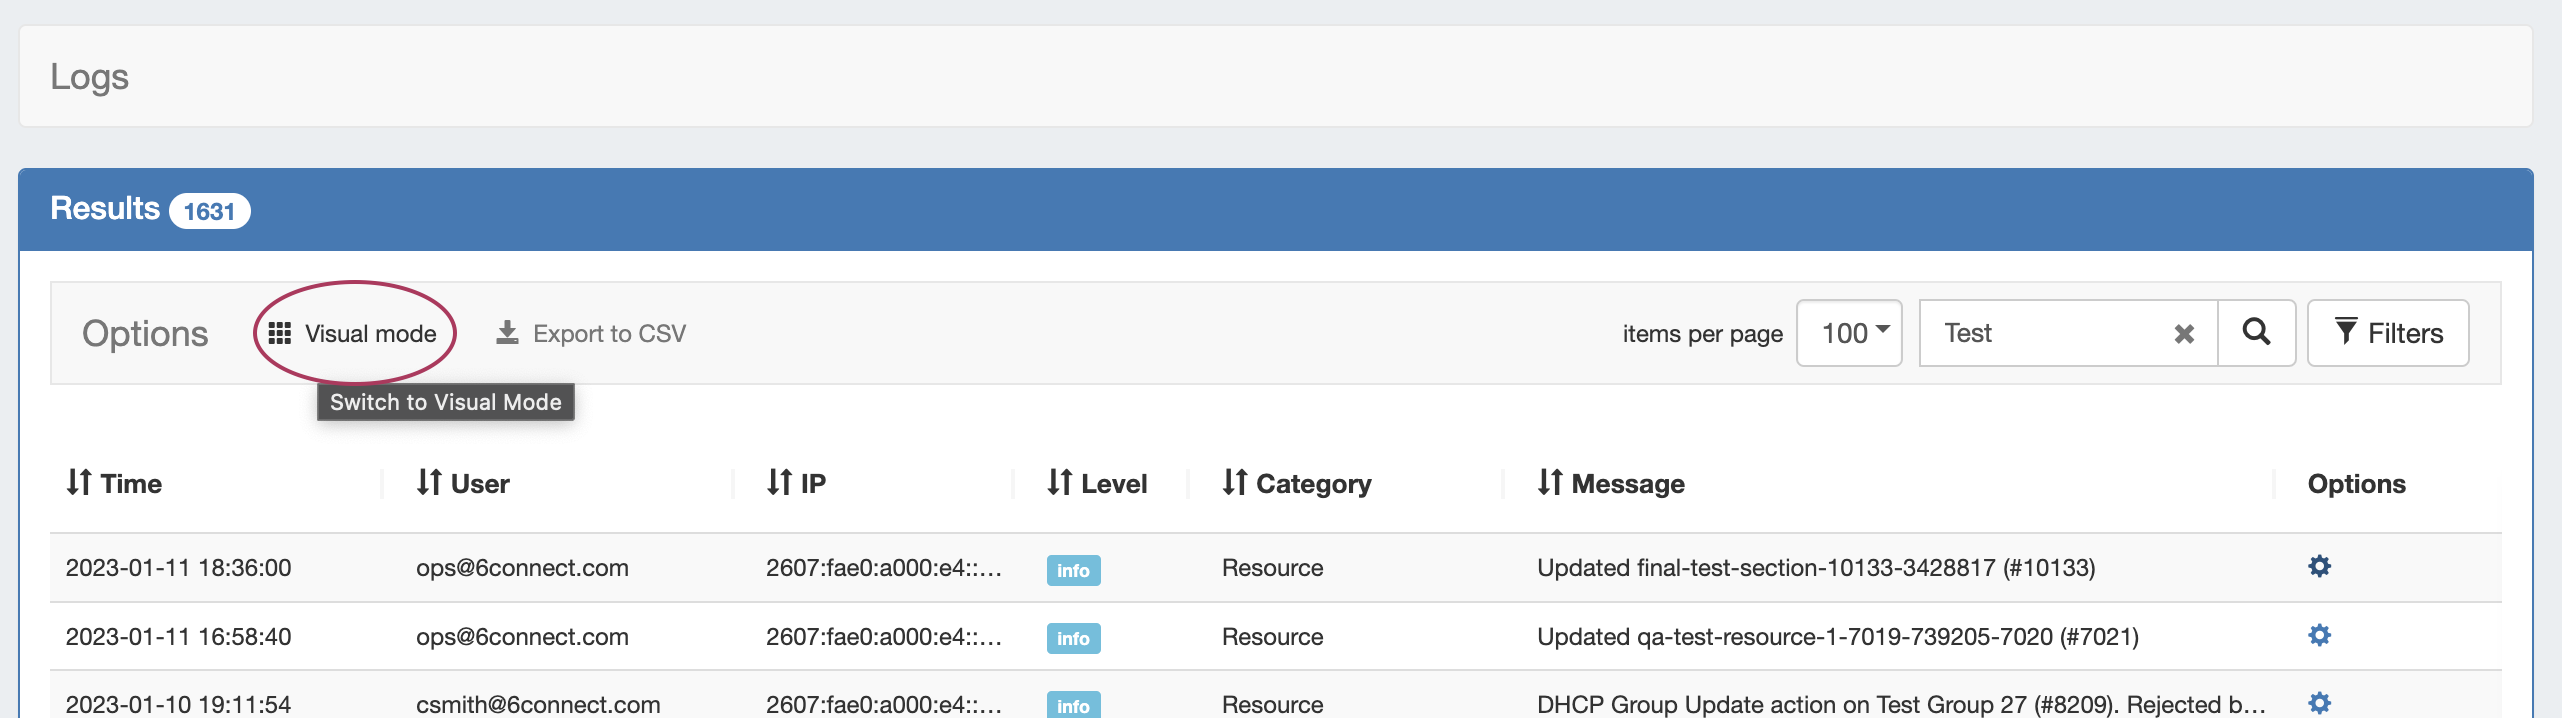
Each log event will be displayed as a color-coded box.
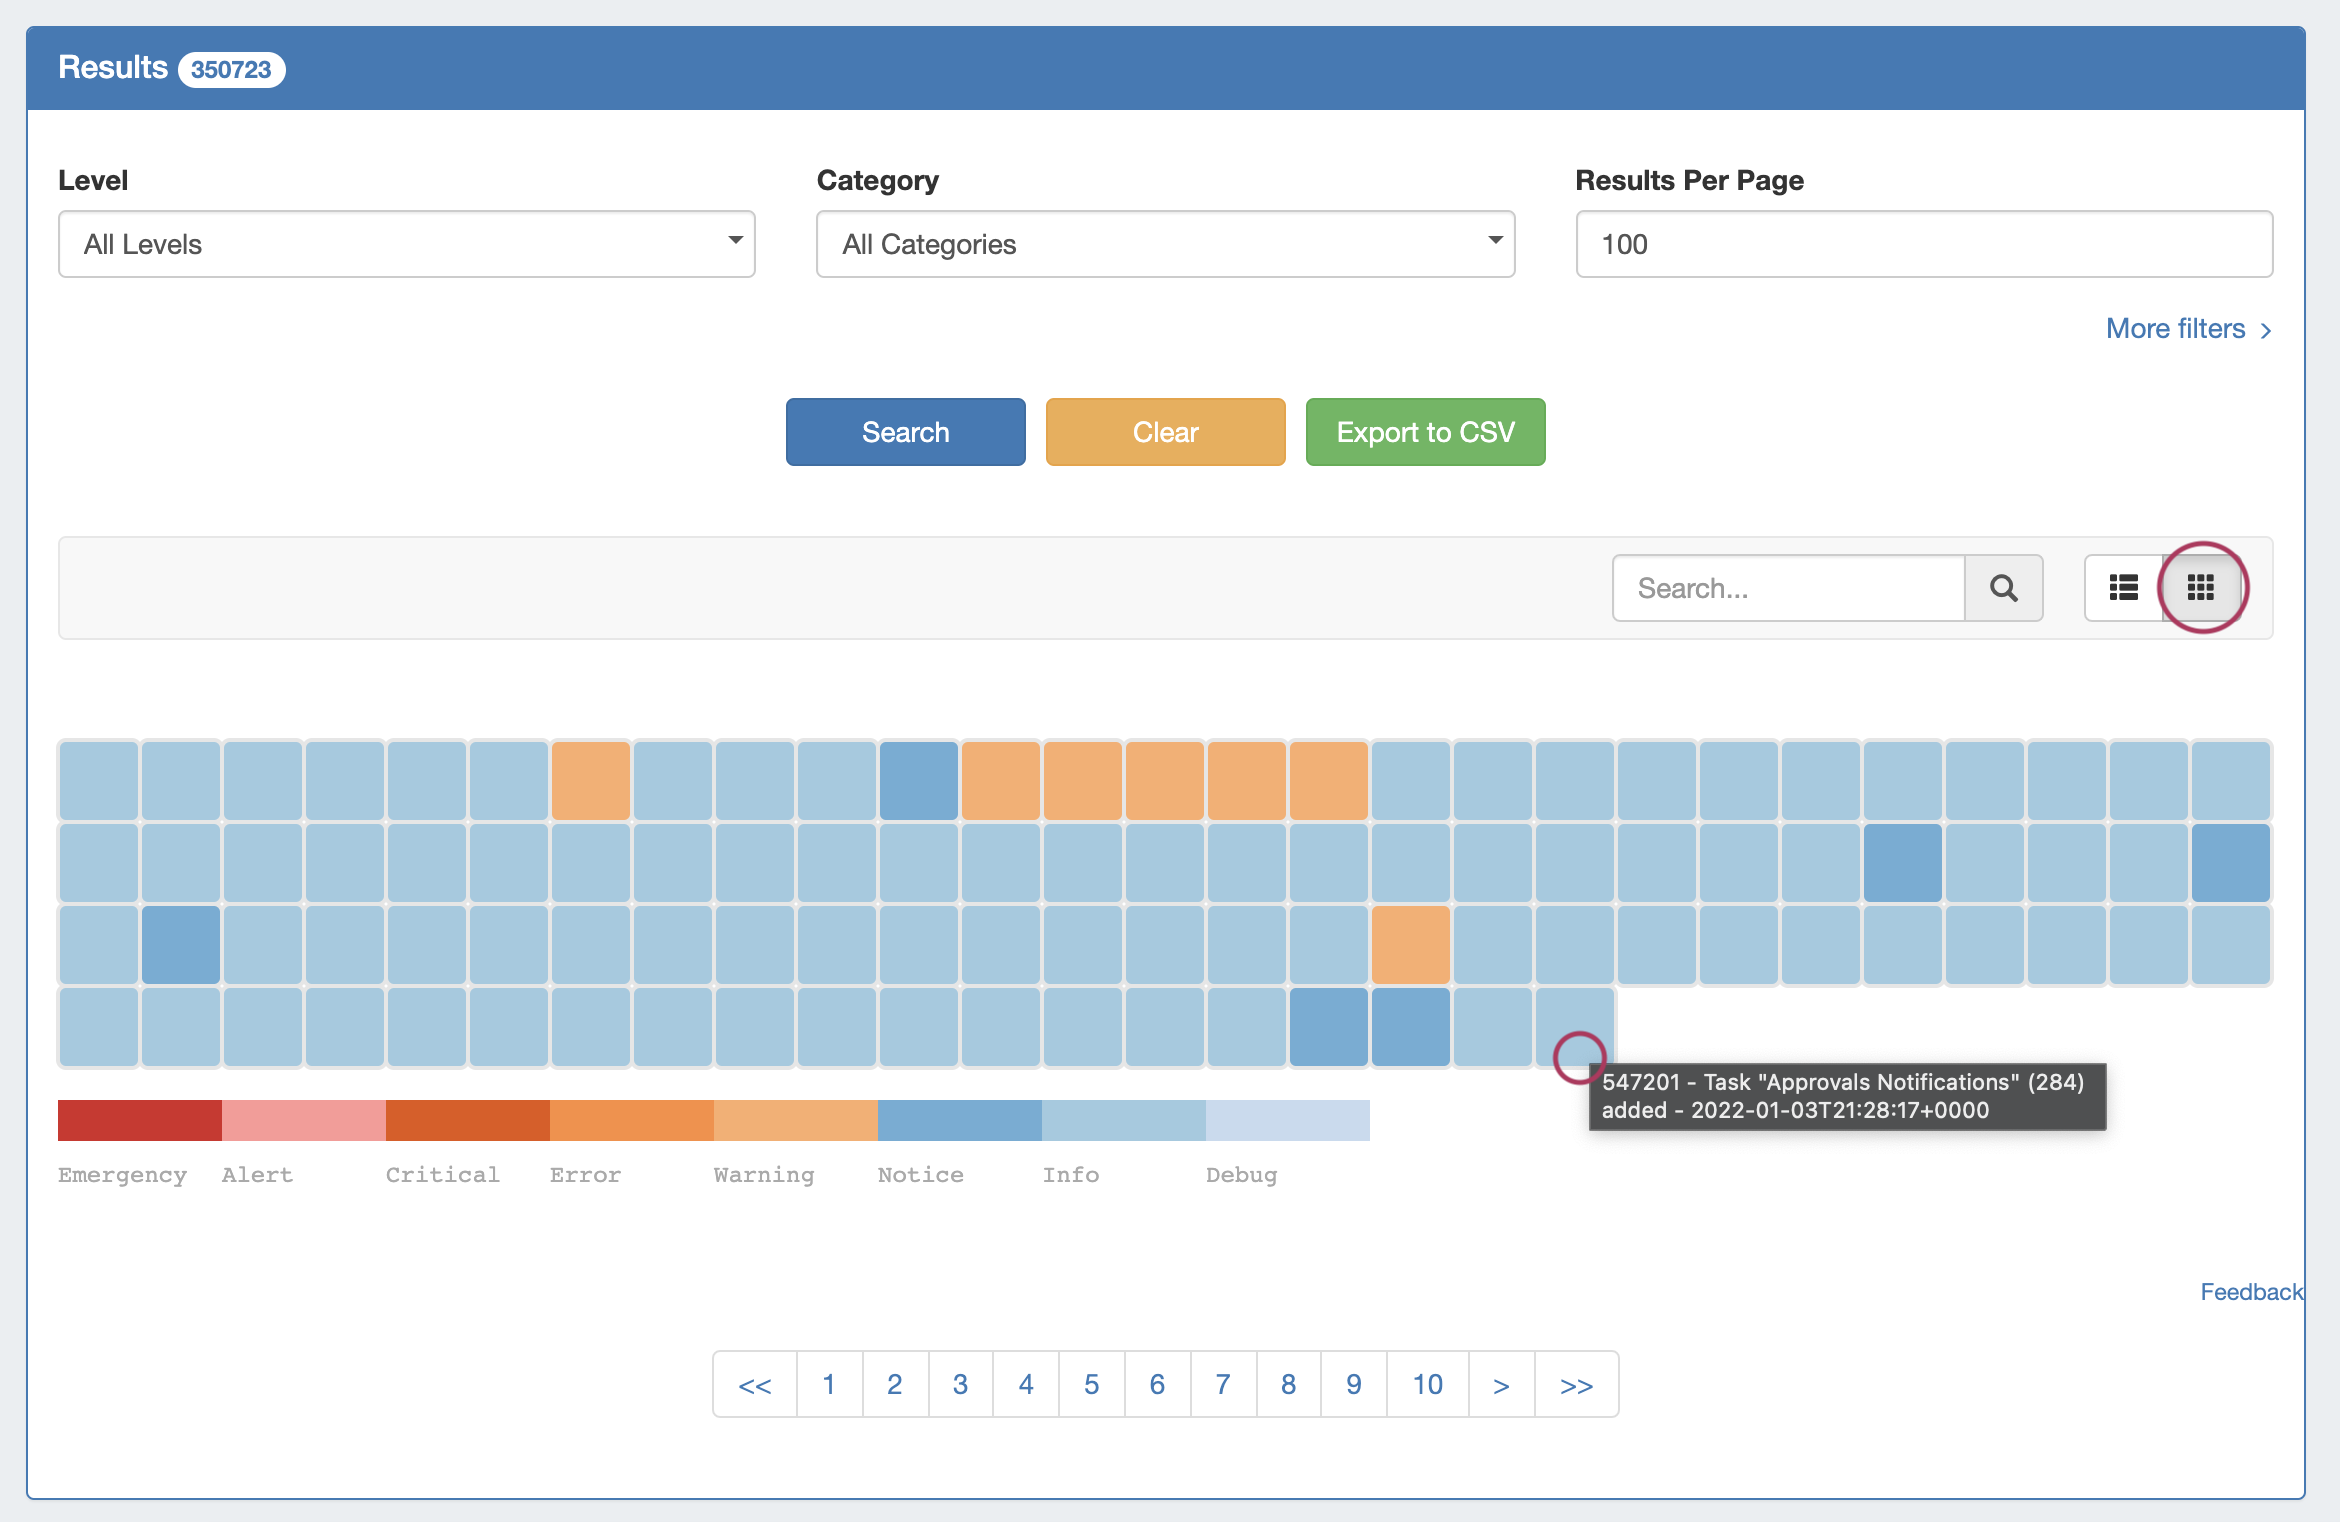
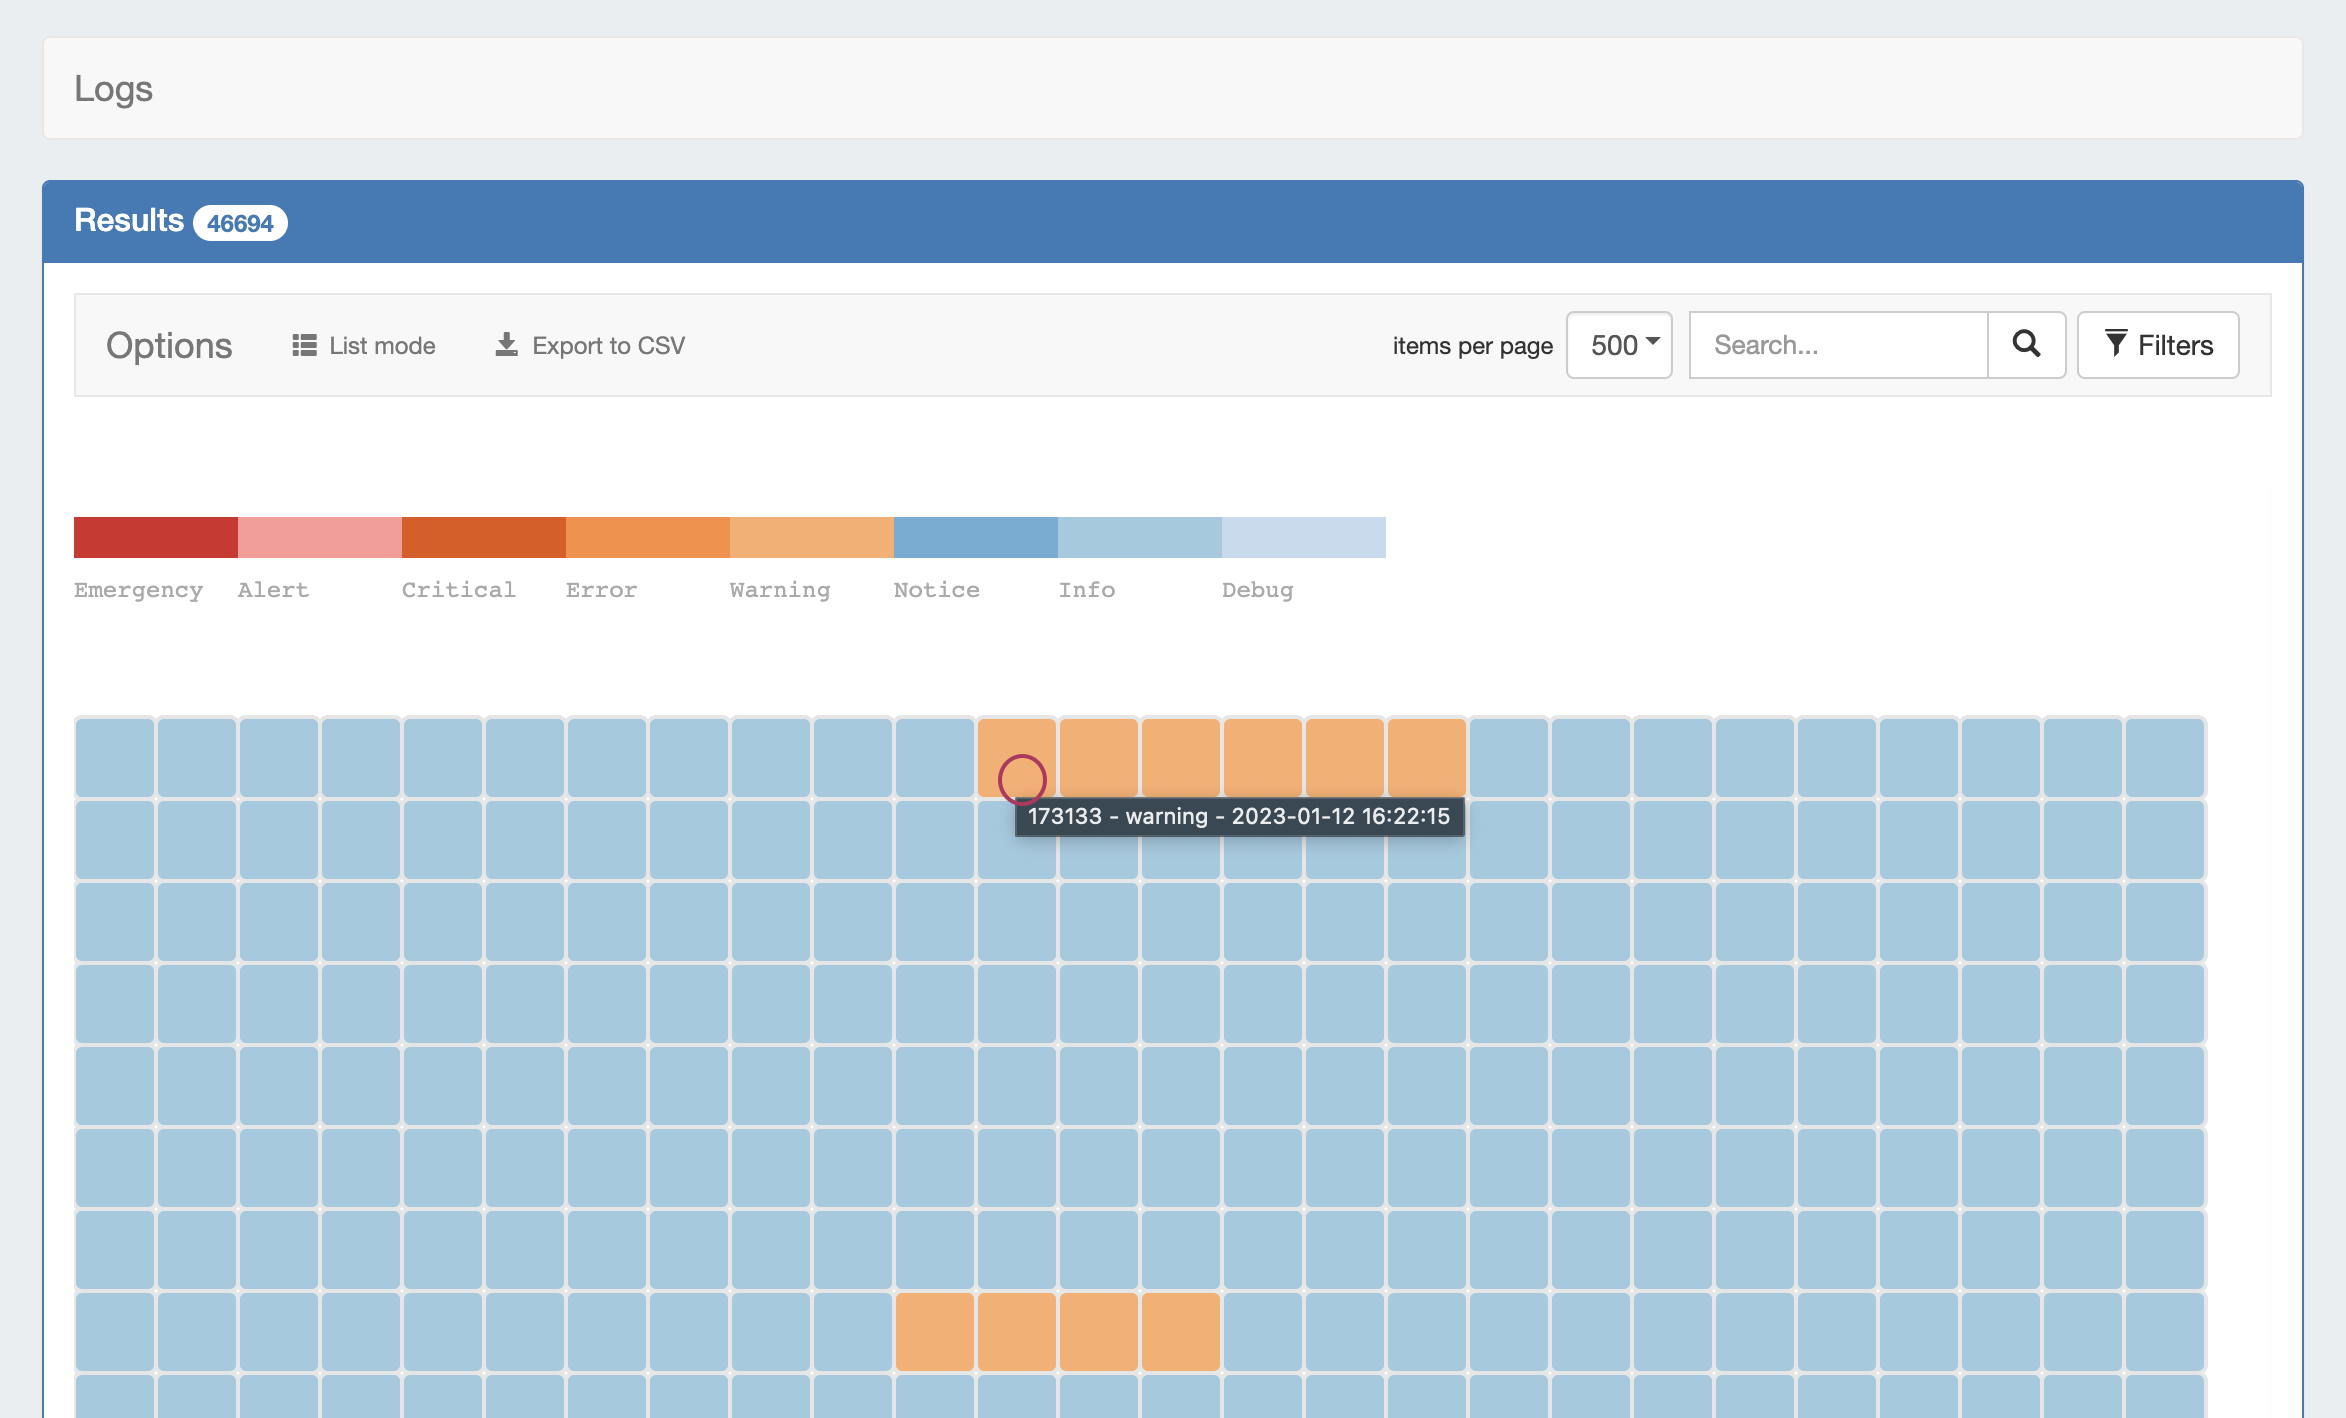
You may view simplified log details by hovering the mouse arrow over an event box, or view extended details by clicking on the event box.
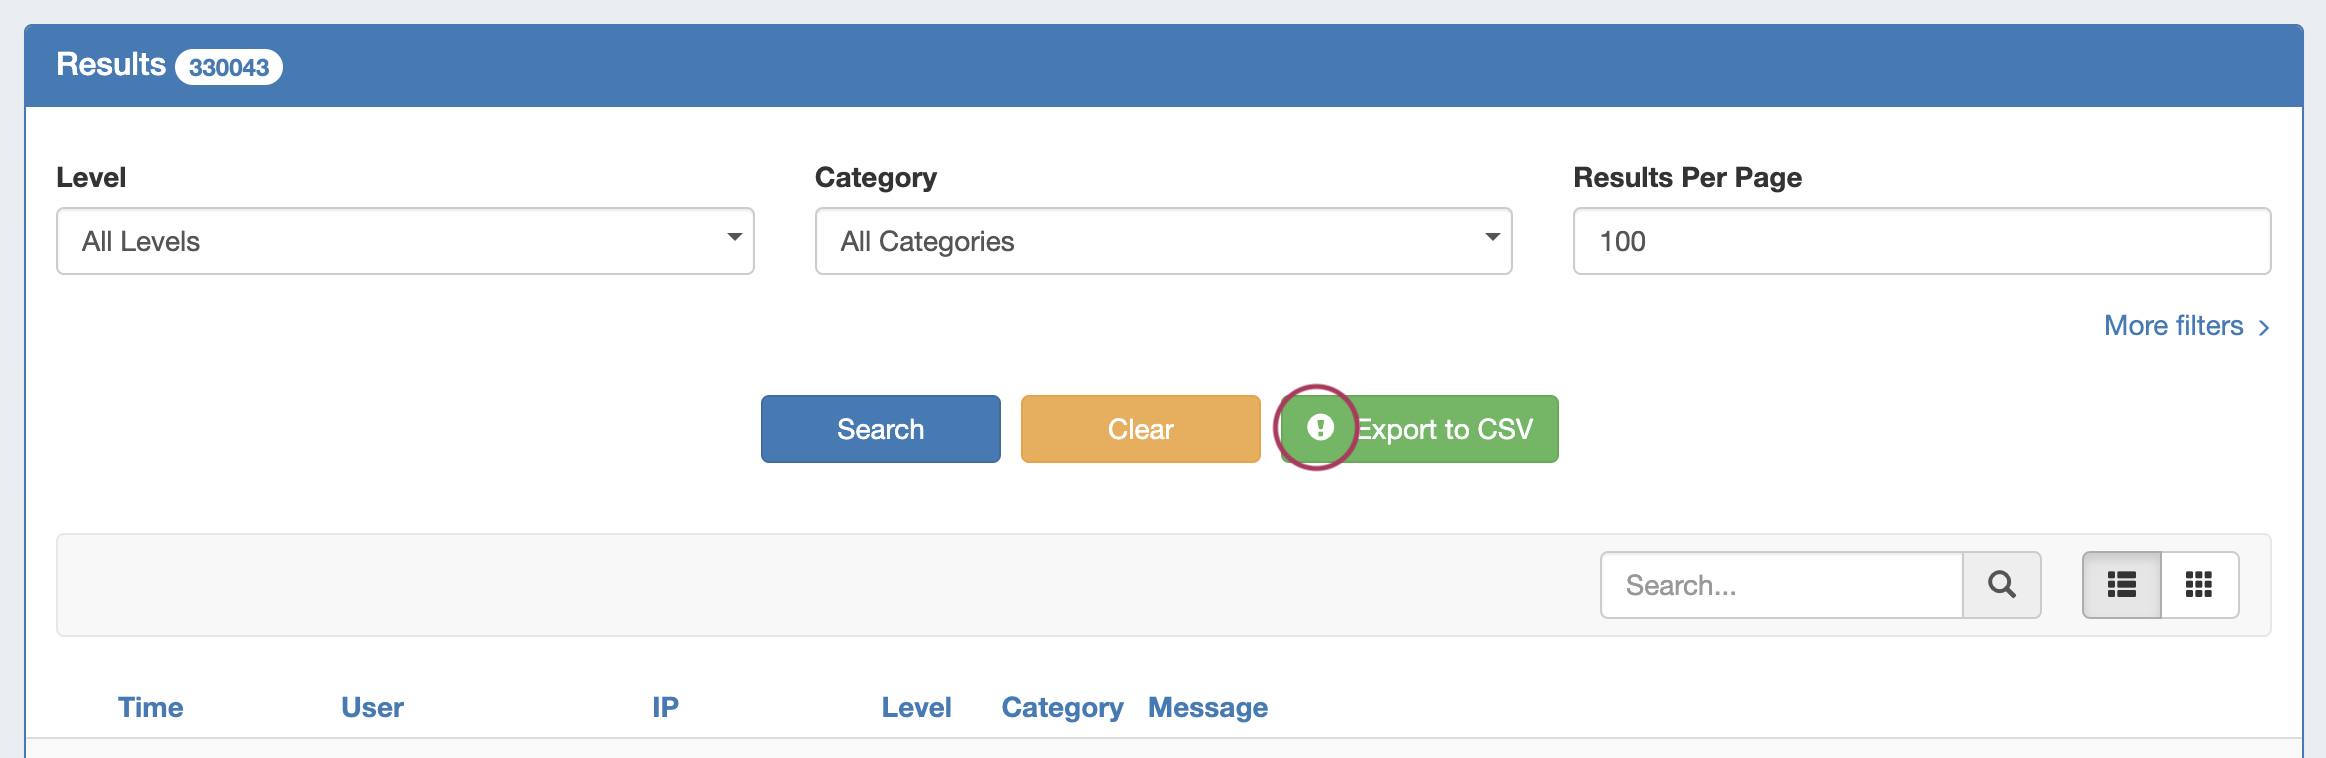
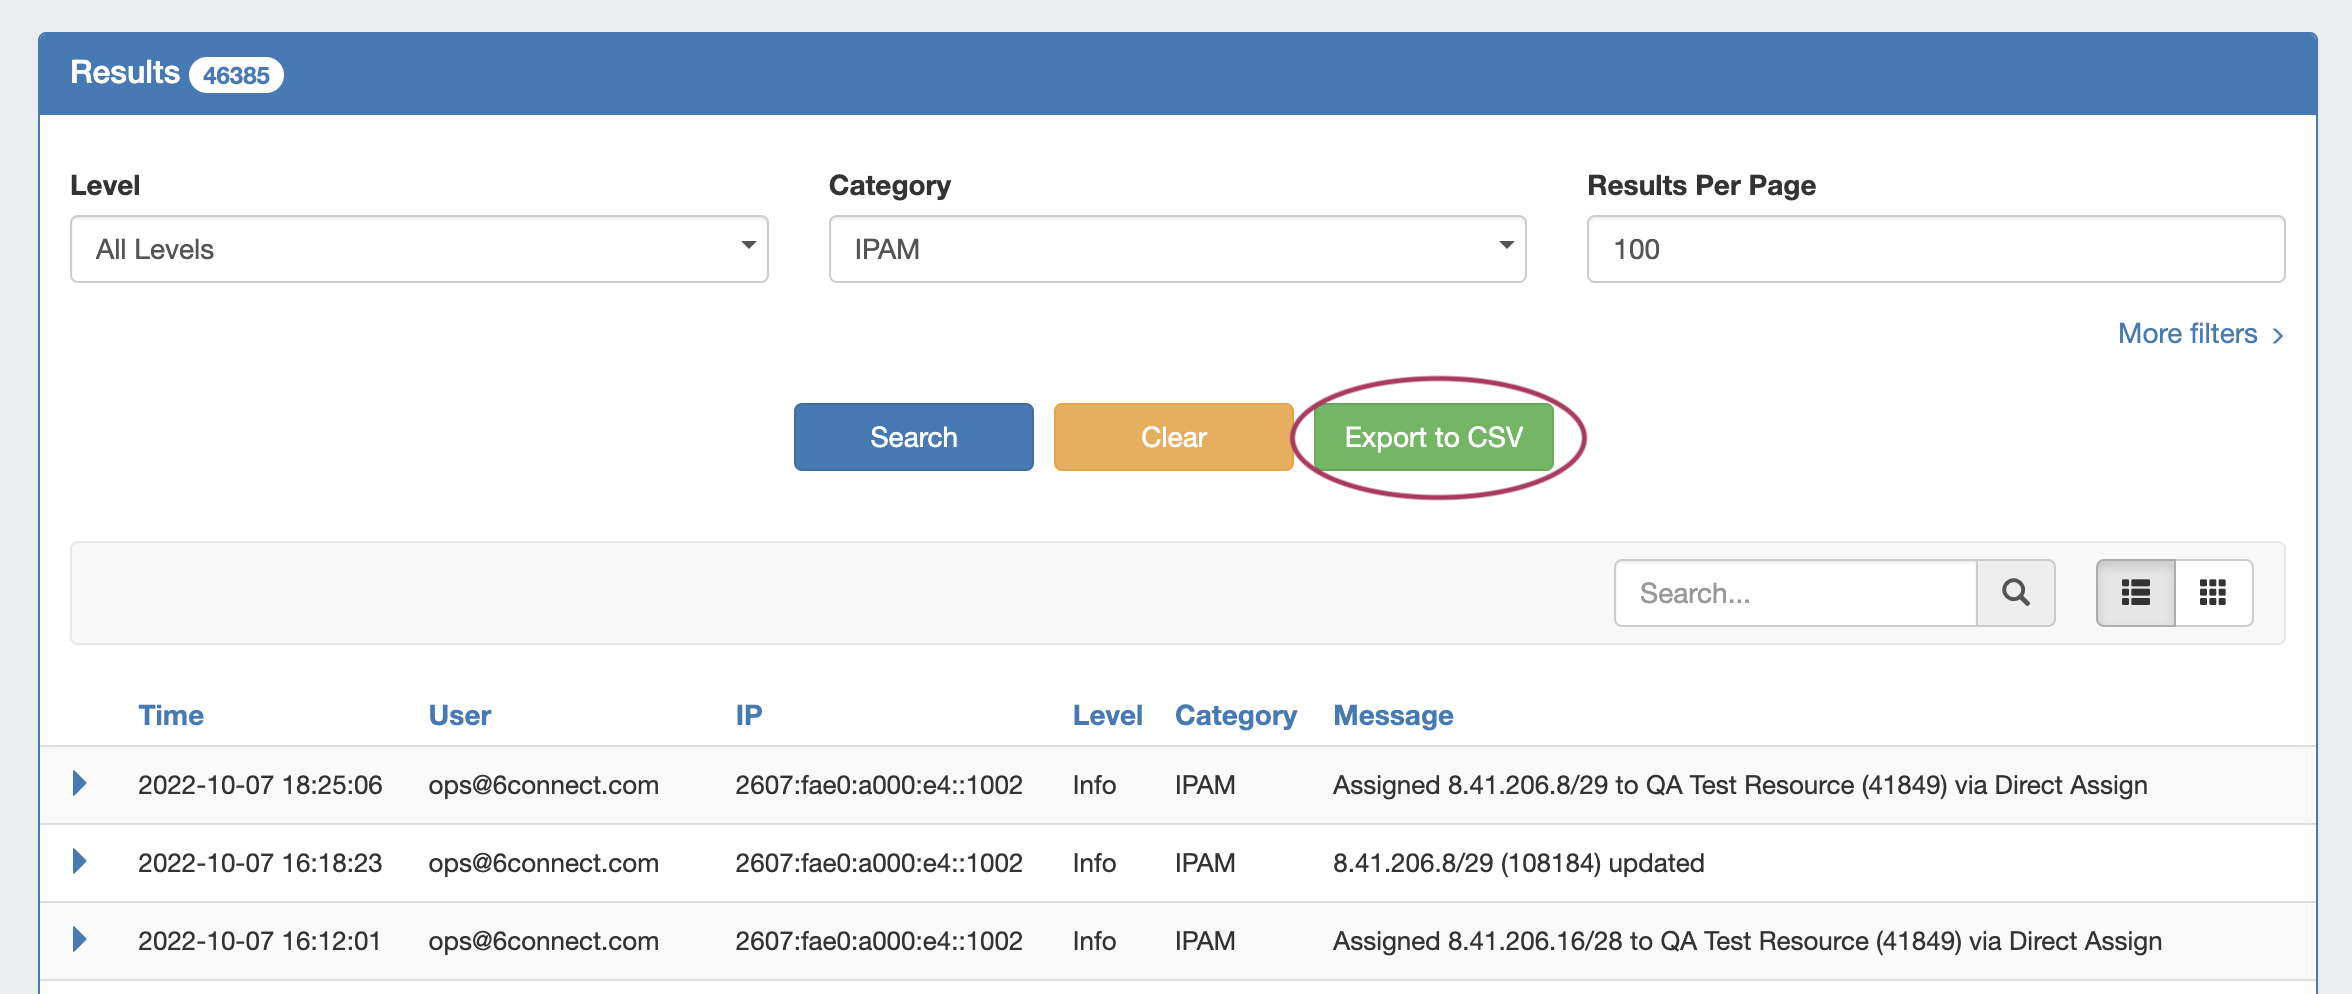
Export Logs
Export the current log search results by clicking the "Export to CSV" button after performing your search.
| Info | ||
|---|---|---|
| ||
Note: Logs -> Export to .csv has a 100,000 record limit. If your current filter options result in more records than that, a warning icon (
Hover the mouse pointer over the icon to view a recommendation that you further filter your results prior to exportingis selected. |