Managed Servers
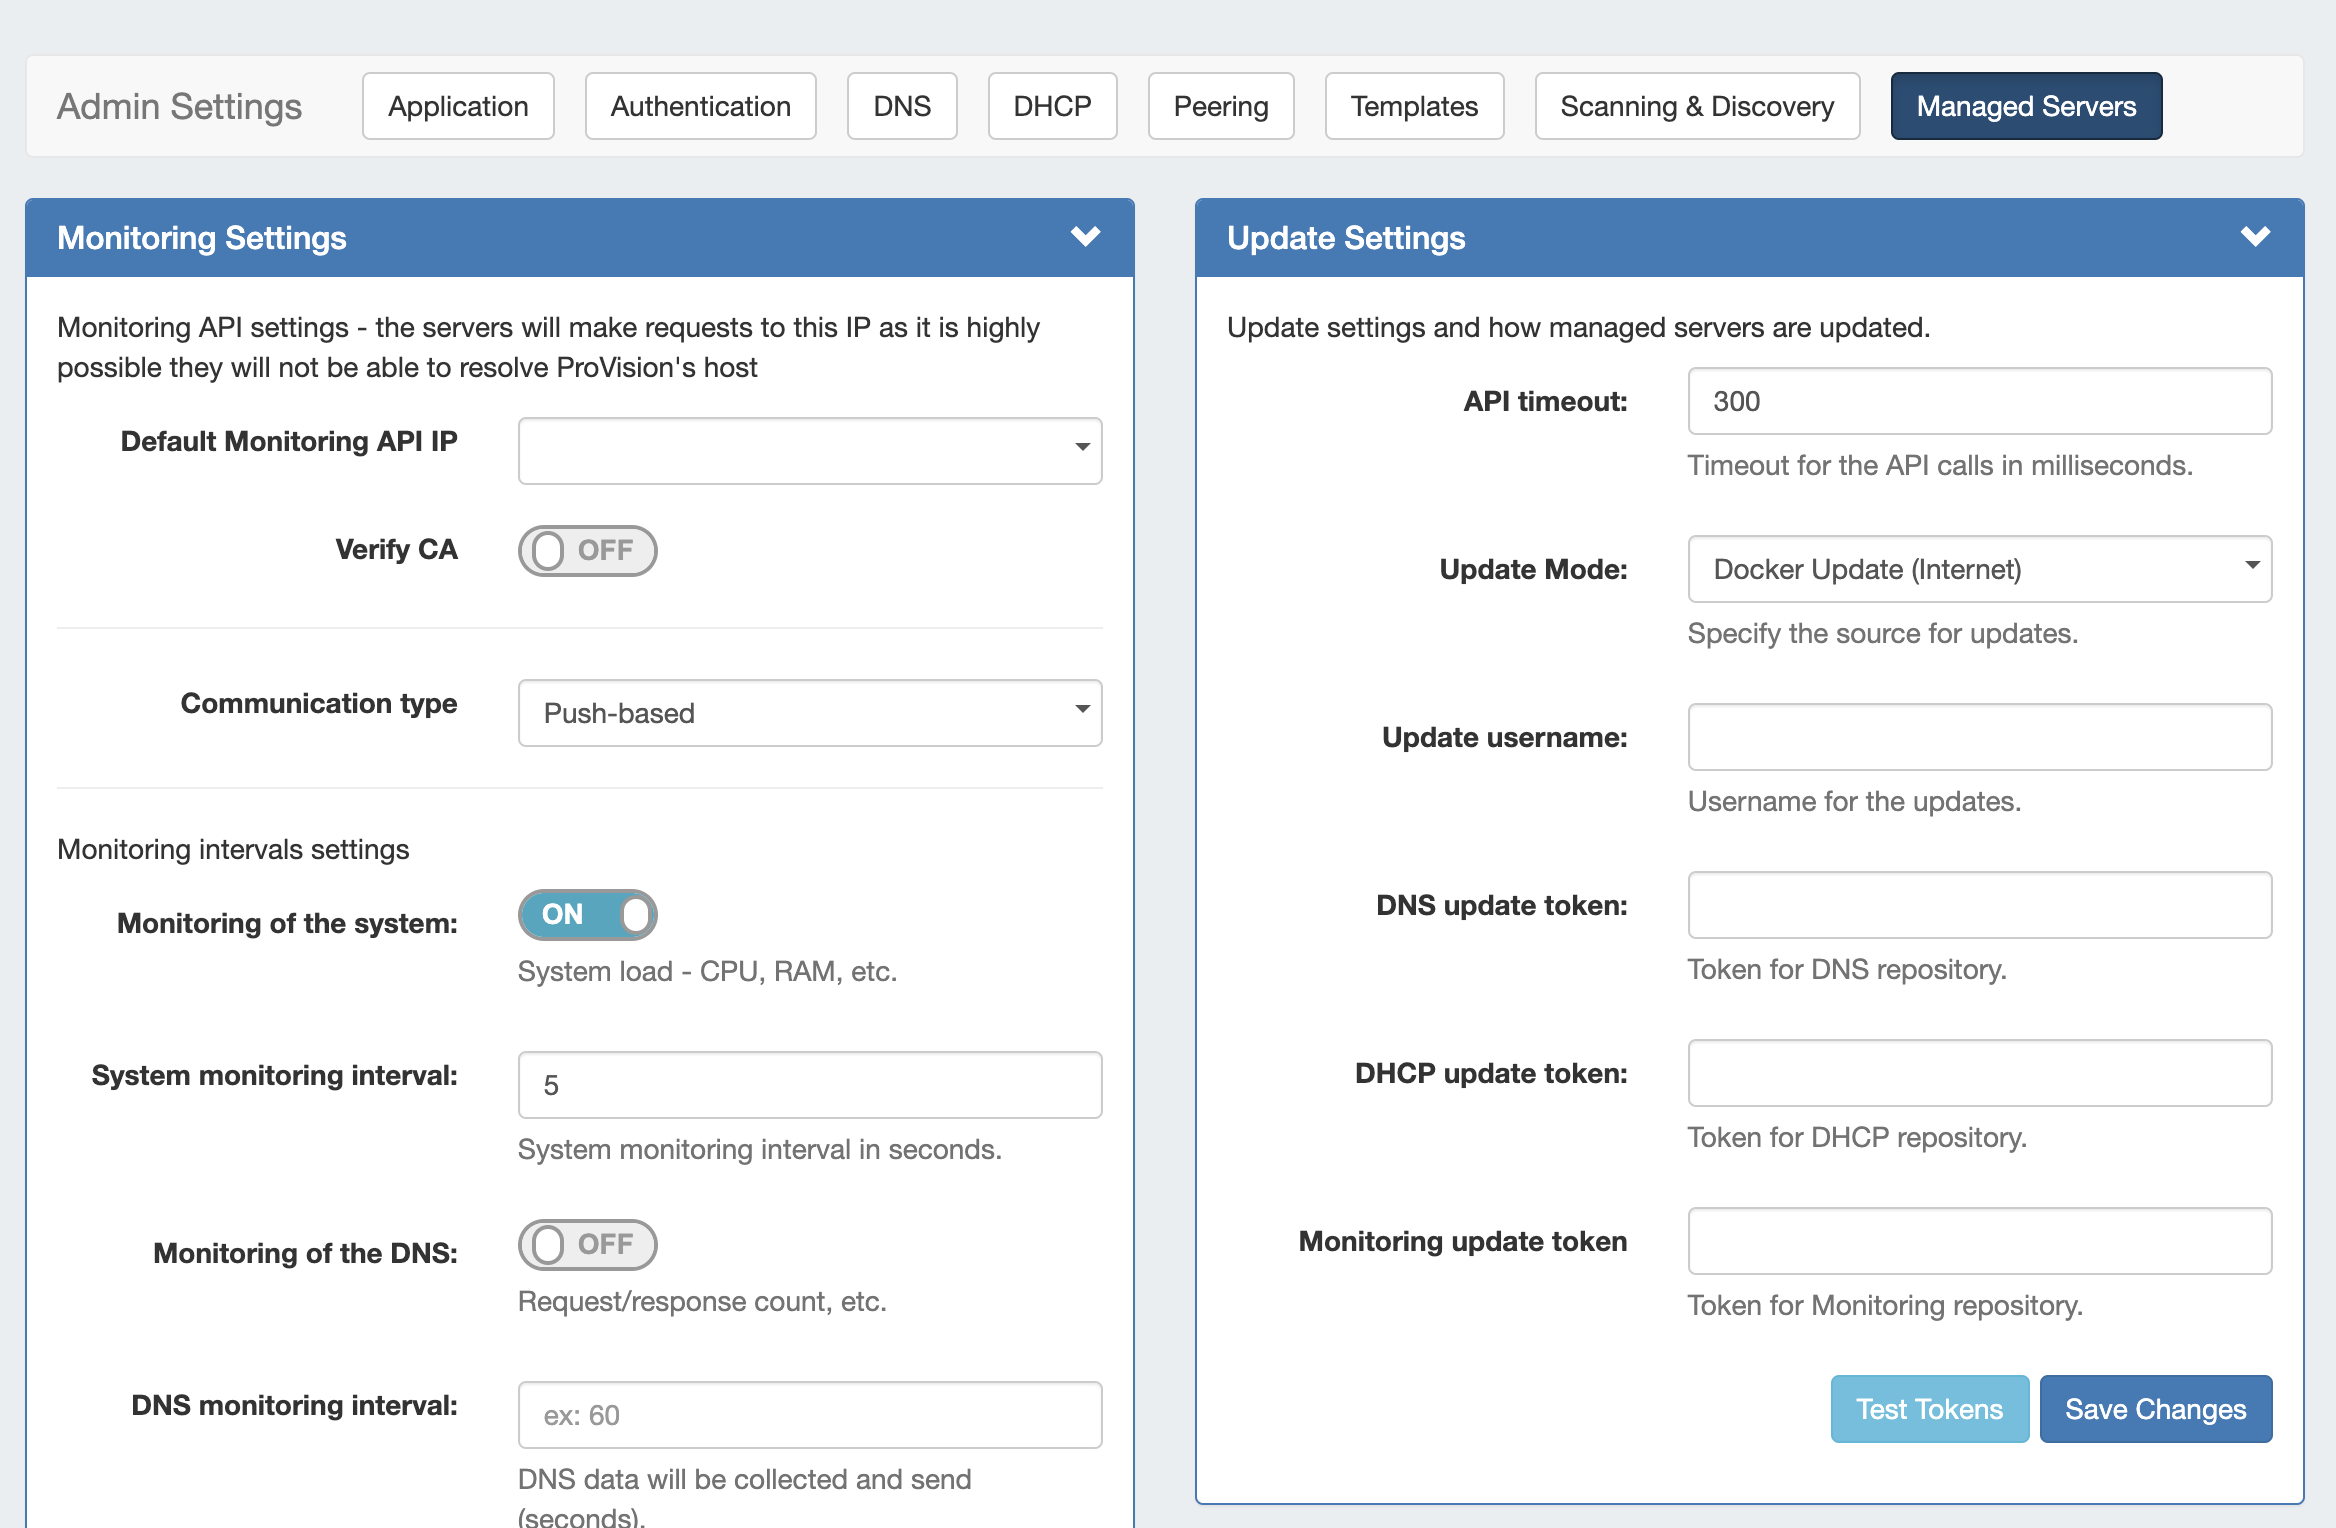
The "Managed Servers" sub-tab under Admin Settings includes modules for Monitoring Settings, Update Settings, Monitoring Services, and RabbitMQ settings.
After making any settings updates, be sure to click "Save Changes" under the updated module.
Overview
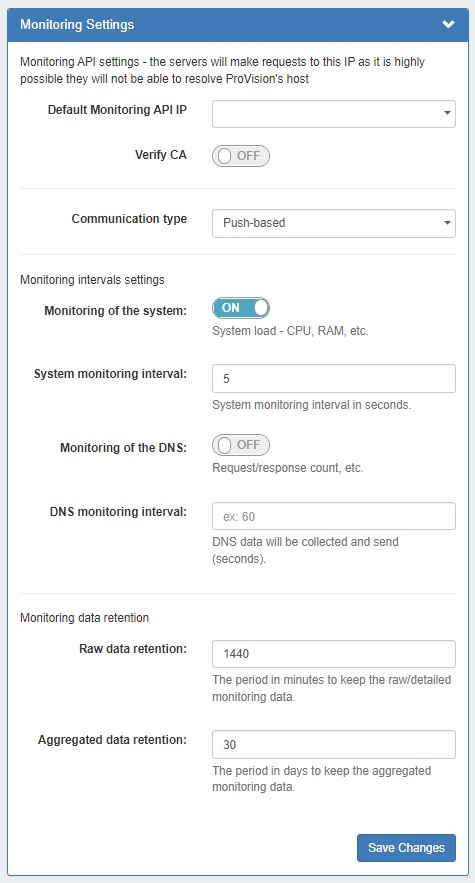
Monitoring Settings
Default Monitoring API IP: The IP to be used for API calls (heartbeat, activation, etc.).
Verify CA: Toggle to "on" if you wish to enable the CA check.
Communication type: Push (when the server pushes data to ProVision) and pull (when ProVision connects to the server and pulls the data). Push is preferred, but Pull-based may be desirable in cases where a firewall would not allow inbound connections to ProVision.
Monitoring of the system: Toggle to "on" to enable monitoring of system statistics.
System monitoring interval: How often (in seconds) the system will be checked. The smaller the interval, the more data there will be to store.
Monitoring of the DNS: Toggle to "on" to enable gathering statistics from the DNS server.
DNS monitoring interval: How often (in seconds) the DNS server will be monitored. Data will be aggregated for the set period of time and the aggregated results will be sent.
Raw data retention: The number of minutes to retain raw data. By default, this is set to 1440 minutes (1 day). Raw data requires sizable storage needs.
Aggregated data retention: The number of days to retain aggregated data.
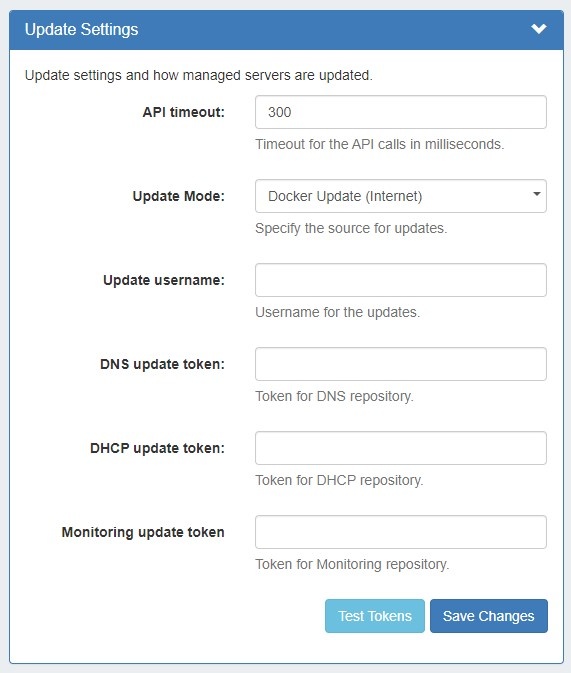
Update Settings (Internet)
API timeout: Timeout for API calls in milliseconds.
Update Mode: Enter the source for updates.
Update username: Enter the username for updates.
DNS update token: Enter the token for the DNS repository.
DHCP update token: Enter the token for the DHCP repository.
Monitoring update token: Enter the token for the Monitoring repository.
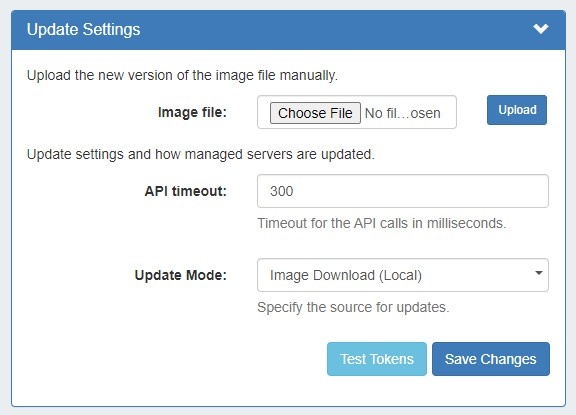
Update Settings (Local)
Image file: Attach the Image file for upload to ProVision.
API timeout: Timeout for API calls in milliseconds.
Update Mode: Enter the source for updates.
Images history: Available only after saving changes.
Test Tokens:
Monitoring Services
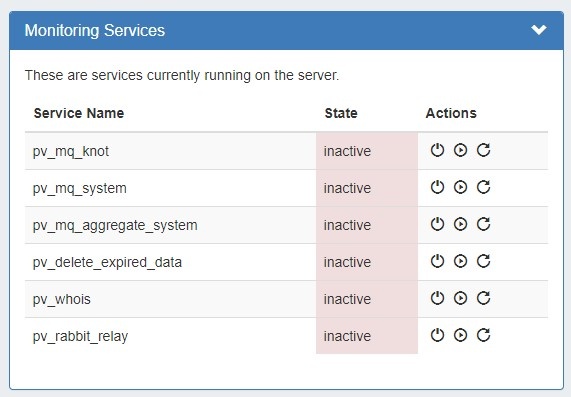
The Monitoring Services module shows the OS services running on Provision's server and their activity state. Available actions are: Stop, Start, and Restart Service.
- pv_heartbeat: sends simple stats from a managed server to ProVision, runs on the managed server
- pv_mq_knot: processes KNOT DNS data from RabbitMQ, runs on ProVision's server
- pv_mq_system: processes system data from RabbitMQ, runs on ProVision's server
- pv_mq_aggregate_system: aggregates system data , runs on ProVision's server
- pv_delete_expired_data: deletes data according to the retention settings, runs on ProVision's server
- pv_whois: runs on ProVision's server
- pv_rabbit_relay: services used in "Pull" setups (see below), runs on ProVision's server
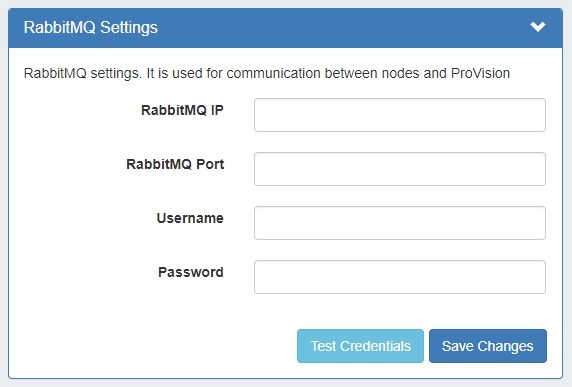
RabbitMQ Settings
Enter or update the following settings:
- RabbitMQ IP
- RabbitMQ Port
- Username
- Password
To verify the settings, click "Test Credentials". When done, click "Save Changes".
After making any settings updates, be sure to click "Save Changes" under the updated module.
Additional Information
For additional information on working with Managed Servers, see Managed Servers
