SNMP Monitoring Setup - Local Installations:
There is a MIB file in the repository (tools/snmp/PROVISION-MIB.mib). It contains the description of the OID numbers provided by ProVision.
Before You Begin
In order to test, you must first install snmpd:
apt-get install snmpd snmp-mibs-downloader
On CentOS7, use the following command: yum install net-snmp net-snmp-utils
Setup Steps
1. Update SNMPD Configuration
Add the following lines in /etc/snmp/snmpd.conf:
view all included   .1.3.6.1.4.1.36009
pass .1.3.6.1.4.1.36009 /usr/bin/php /var/www/html/[/var/www/html/[$ProVisionDir]/tools, etc]/tools/snmp/Provision.php
2. Update MIB Library
Add the MIB file to the shared mib library:
ln -s /var/www/html/[/var/www/html/[$ProVisionDir]/tools/snmp/PROVISION-MIB.mib /usr/share/snmp/mibs/PROVISION-MIB.txt
3. Restart Server
Restart the webserver:
systemctl restart snmpd
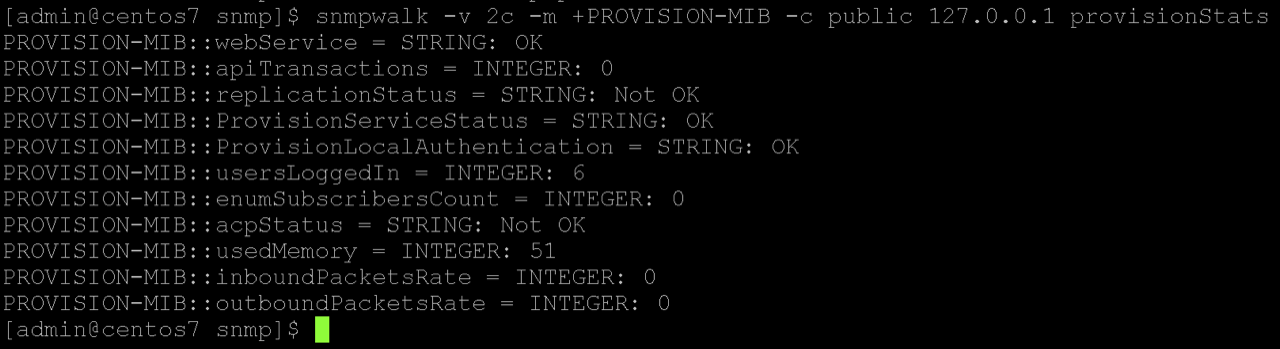
4. Test
Verify the SNMP is working:
snmpwalk -v 2c -m +PROVISION-MIB -c public 127.0.0.1 provisionStats
Additional Information
These are OID numbers from which SNMP clients can gather information. They are directly provided by the OS:
CPU Load Time
- 1 minute Load: .1.3.6.1.4.1.2021.10.1.3.1
- 5 minute Load: .1.3.6.1.4.1.2021.10.1.3.2
- 15 minute Load: .1.3.6.1.4.1.2021.10.1.3.3
Memory
- Total memory:
.1.3.6.1.4.1.2021.4.5.0 - Memory Free:
.1.3.6.1.4.1.2021.4.6.0
Disks
- Path where the disk is mounted:
.1.3.6.1.4.1.2021.9.1.2.1 - Path of the device for the partition:
.1.3.6.1.4.1.2021.9.1.3.1 - Total size of the disk/partion (kBytes):
.1.3.6.1.4.1.2021.9.1.6.1 - Available space on the disk:
.1.3.6.1.4.1.2021.9.1.7.1 - Used space on the disk:
.1.3.6.1.4.1.2021.9.1.8.1 - Percentage of space used on disk:
.1.3.6.1.4.1.2021.9.1.9.1 - Percentage of inodes used on disk:
.1.3.6.1.4.1.2021.9.1.10.1
Network
- Network interfaces:
.1.3.6.1.2.1.31.1.1.1.1 - Network Received Packets:
.1.3.6.1.2.1.31.1.1.1.7.1 - Network Outgoing Packets:
.1.3.6.1.2.1.31.1.1.1.11.2 - Individual counters for incoming traffic in bytes:
.1.3.6.1.2.1.31.1.1.1.6 - Individual counters for outgoing traffic in bytes:
.1.3.6.1.2.1.31.1.1.1.10 - The number of inbound packets that contained errors
.1.3.6.1.2.1.2.2.1.14 - Current maximum allowed connections (ProvisionStats.maxConnections)
.1.3.6.1.4.1.36009.4.0 - The peak number of connections since the database server daemon was started (ProvisionStats.maxUsedConnections)
.1.3.6.1.4.1.36009.4.1 - The number of currently open connections (ProvisionStats.threadsConnected)
.1.3.6.1.4.1.36009.4.2
NOTE: If the MySQL maximum connections limit is reached, then ProVision will not be able to respond to the SNMP Daemon, as it will not be able to connect to MySQL. Please keep this in mind when setting alert thresholds.
NOTE: ProVision collects information from /proc/meminfo. We calculate usedMemory in the following way: 100 - ((availableMemory / totalMemory) * 100).
ProVision SNMP KPIs can be configured to send trap events for the ProVision application. For the host system KPIs (CPU, RAM, etc.) the monitoring tool will need to be configured to poll the KPIs and then set the alert thresholds accordingly.