Working with Managed Servers
The Managed Server page is where you can add a new server, view the list of existing servers, and view monitoring data on each server. From here, you may also access server settings and details for each server.
Requirements
Note: Managed Servers requires Python3 and Docker to be installed to support this feature.
The Managed Server List Interface
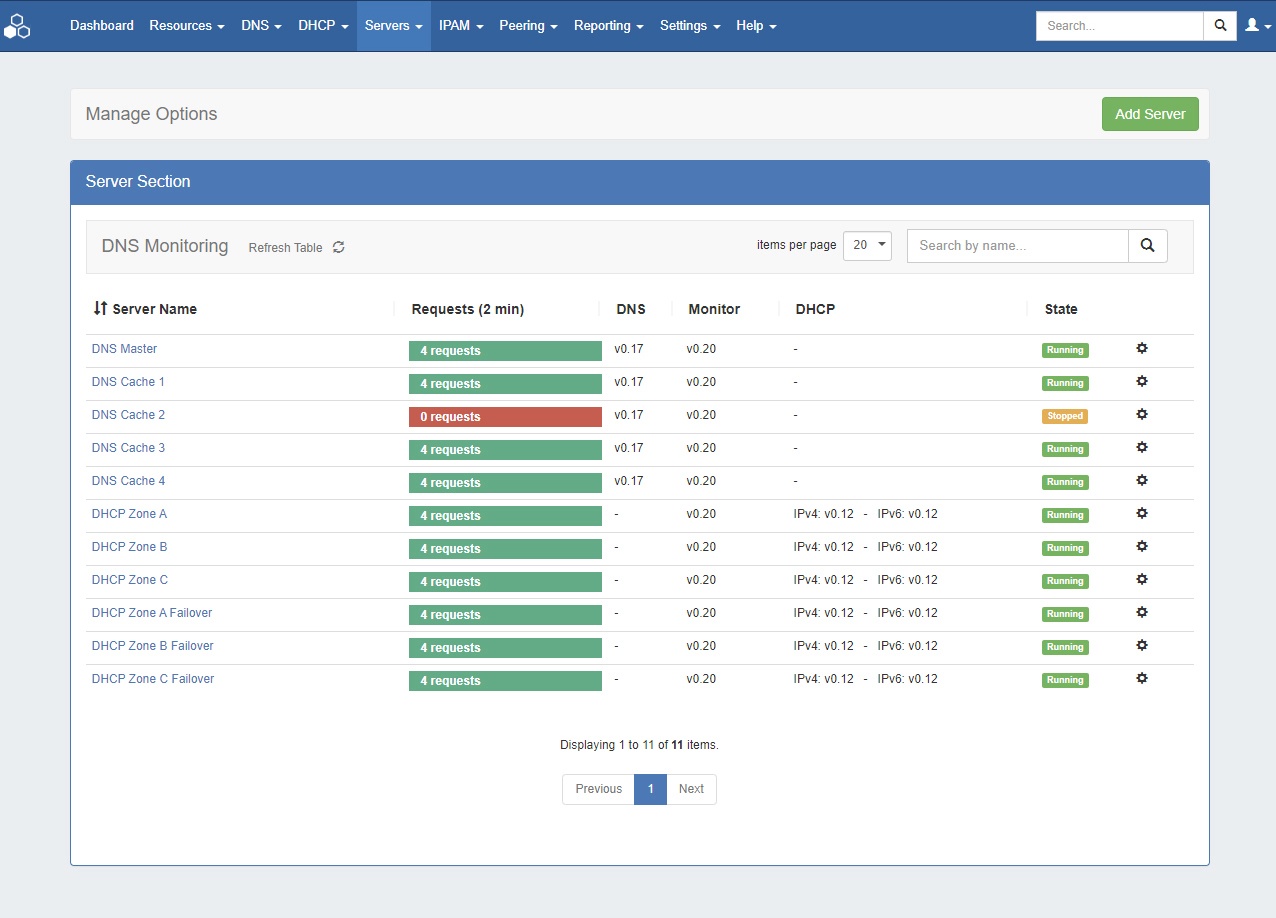
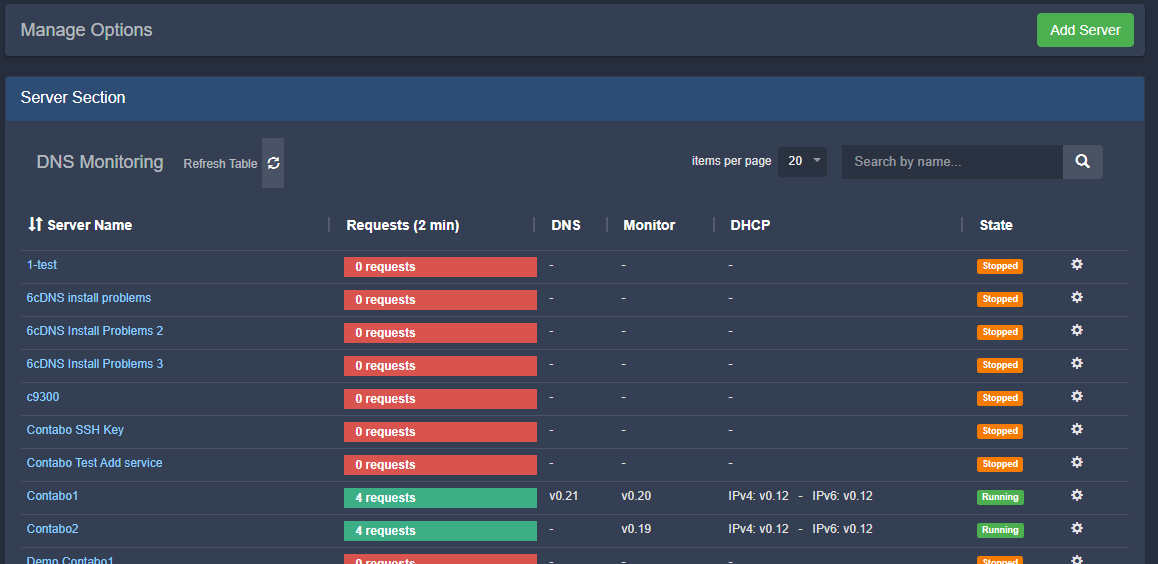
The Managed Server Section List provides server and monitoring data for each managed DNS / DHCP server.
The list provides the following information:
Server Name: The server display name, set by the user during server creation. You may click on the server name link to view server details
Requests: Requests are the heartbeat notifications received in the last 2 minutes. Requests are sent every 30 seconds, so a display of 4 or 5 requests represents a satisfactory request connection, and the request bar will show in green. For any lower value, the color of the bar will show in red.
DNS / Monitor / DHCP: The version of the component running. If the server is not running, no version will display.
State: State shows the overall state of the server - the server may be running, but without any components started. "Running" will show in green, whereas "Stopped" will display as an orange bar.
Action Menu (gear icon): Right click on the action menu (or anywhere on the row) to display available server actions
Working with the Managed Server List
The following actions may be performed when interacting with the server list:
Sort the list by clicking on the "Server Name" column, to view by Ascending / Descending order
Search / Filter the list for specific servers by entering a full or partial server name into the search box at the upper right of the list
Display more/fewer servers per page by clicking on the "Items per page" selector at the top right of the list, next to the search box
Refresh the list to check for updated information by clicking the "Refresh Table" button (rotating arrows)
Click on a server name to view / edit server details
Add New Managed Server (Setup Wizard)
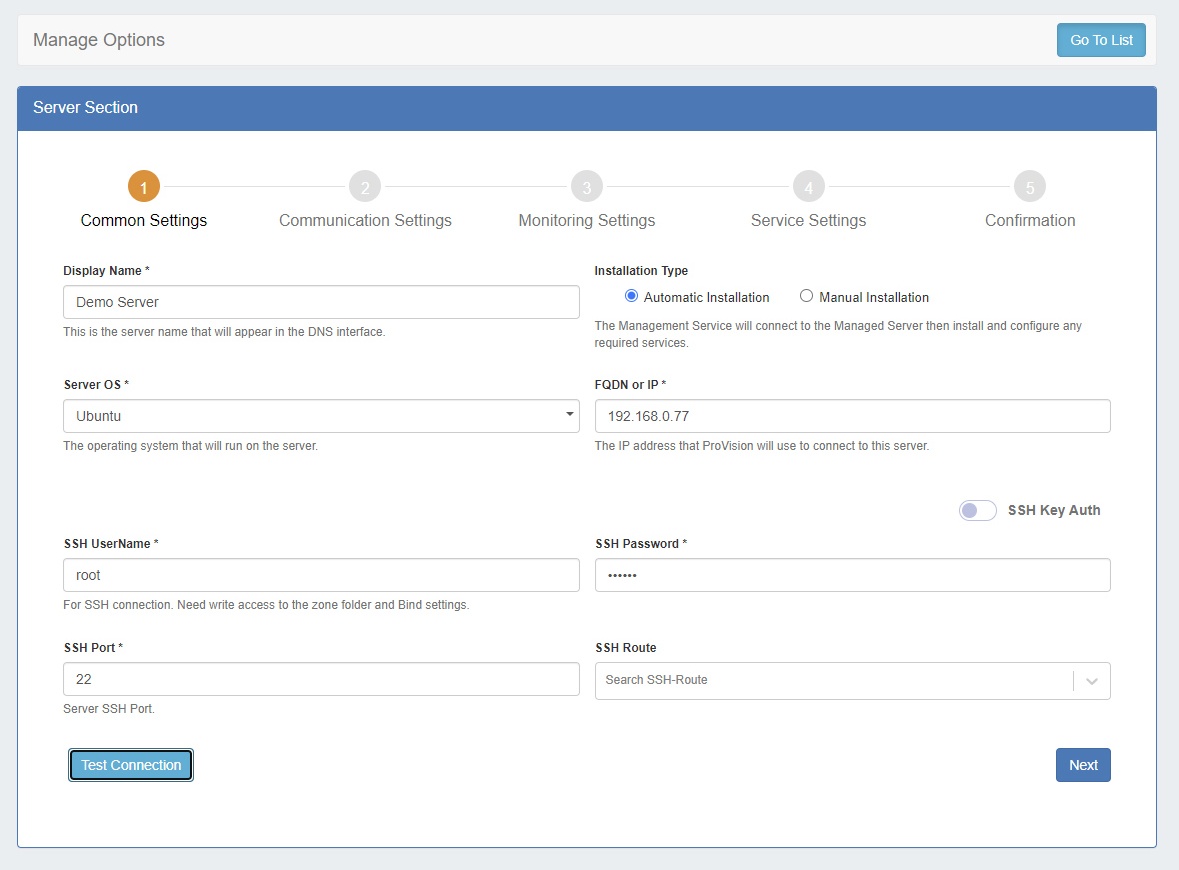
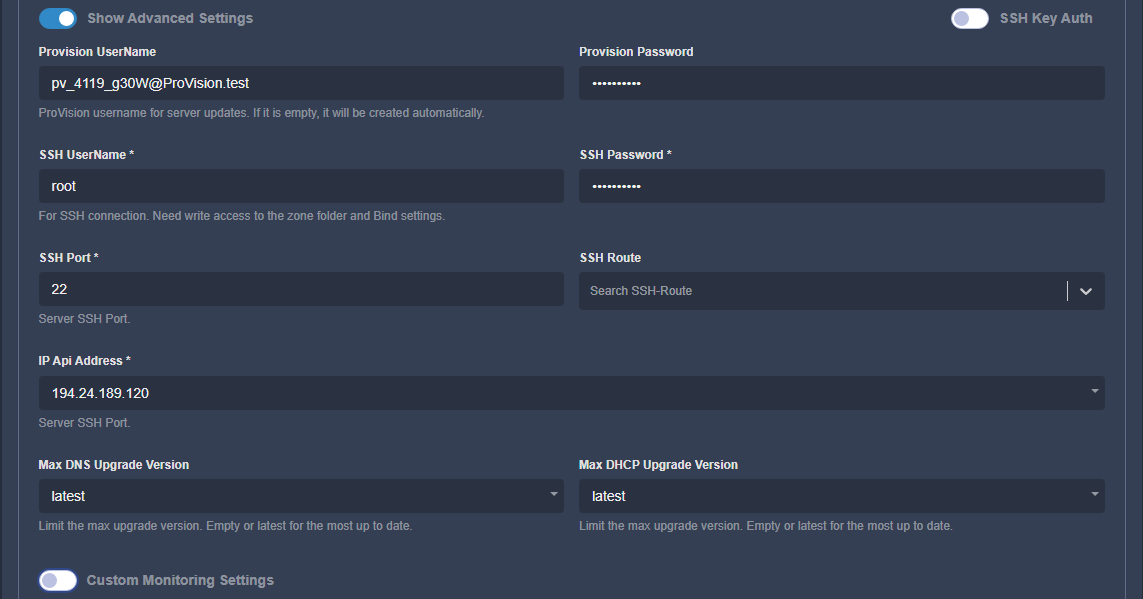
Before you begin, you will need to know following connection information for the new managed server:
- Server FQDN or IP
- Desired server OS
- SSH credentials and port
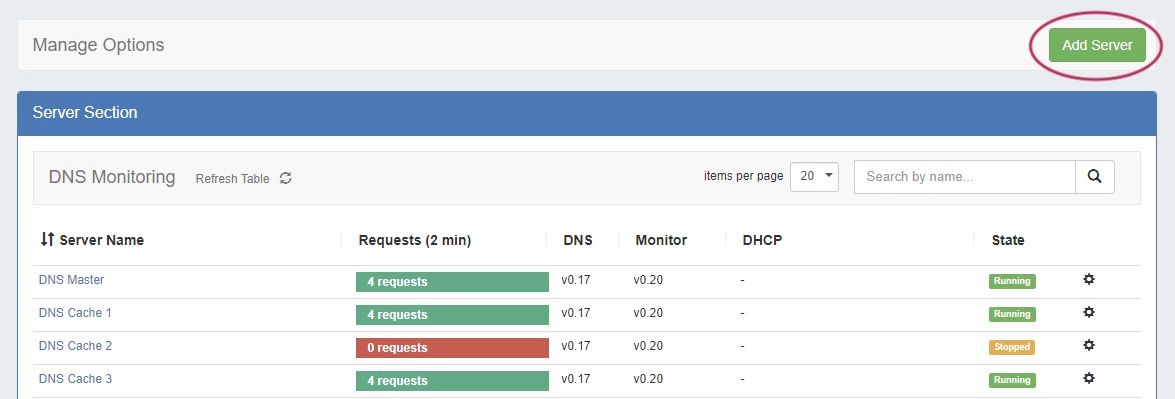
To set up a new managed server, click "Add Server" at the top right of the Managed Server Tab.
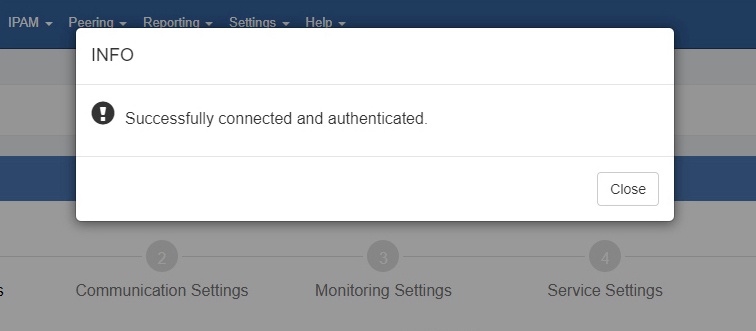
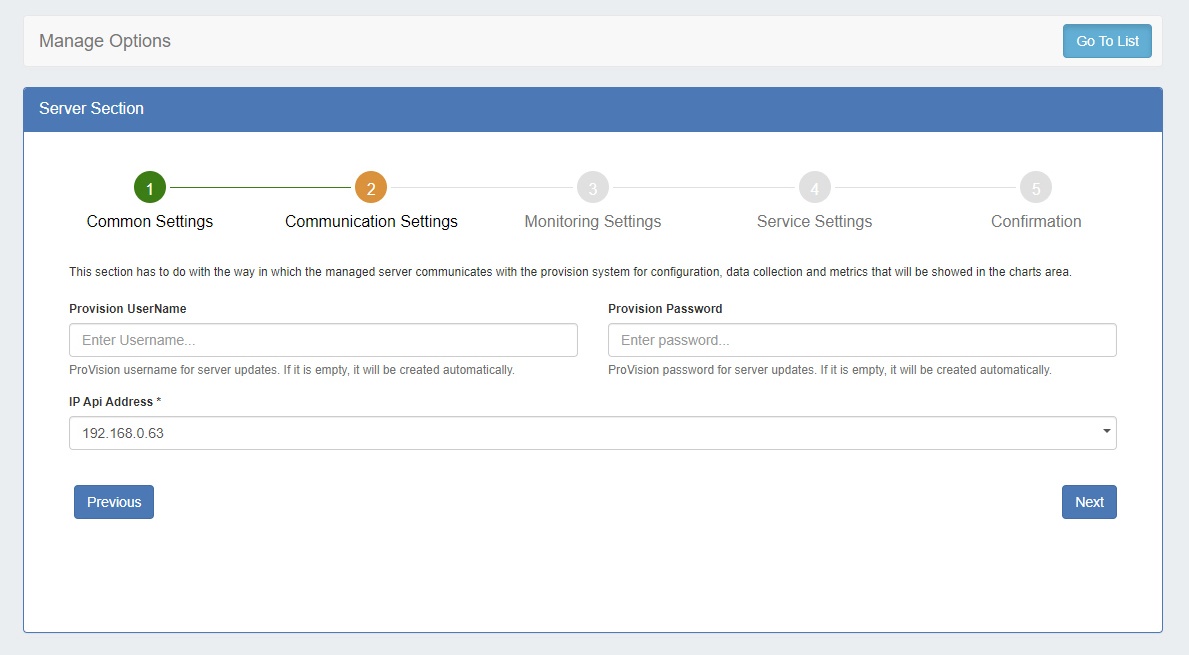
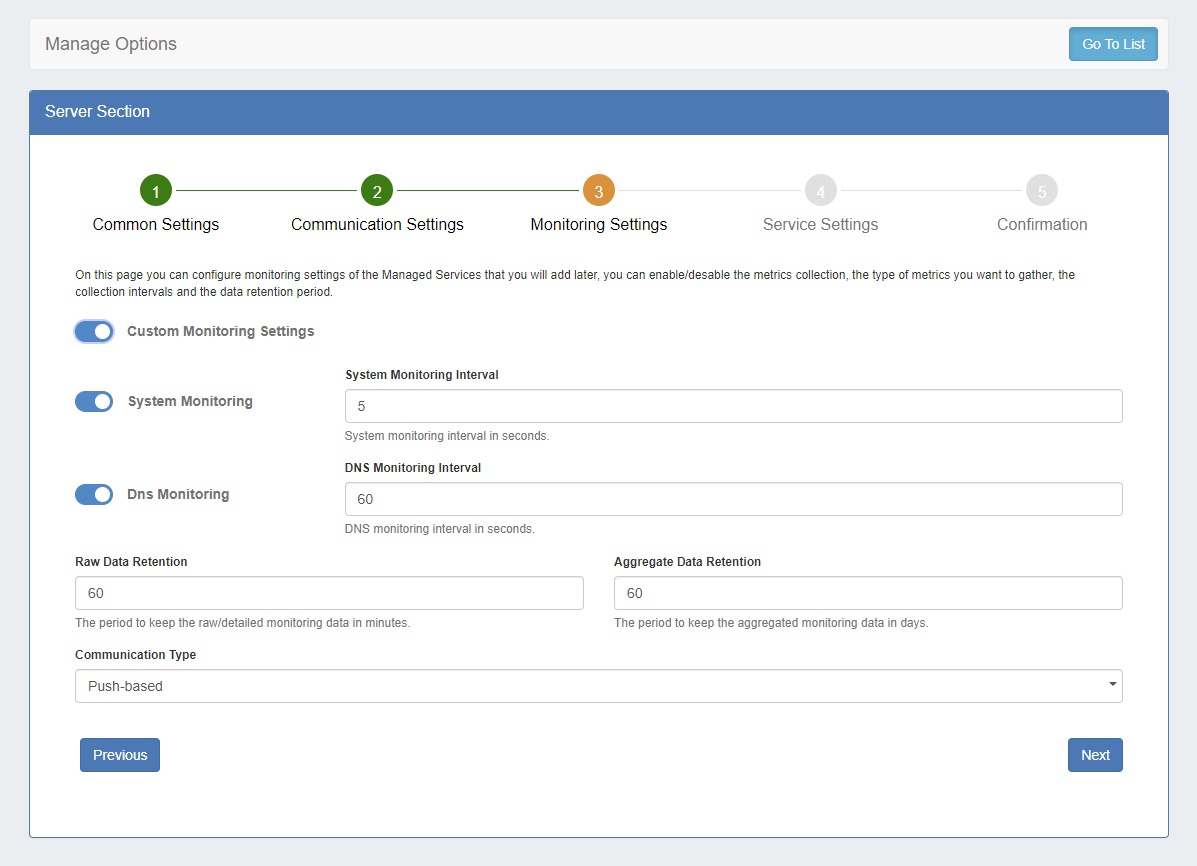
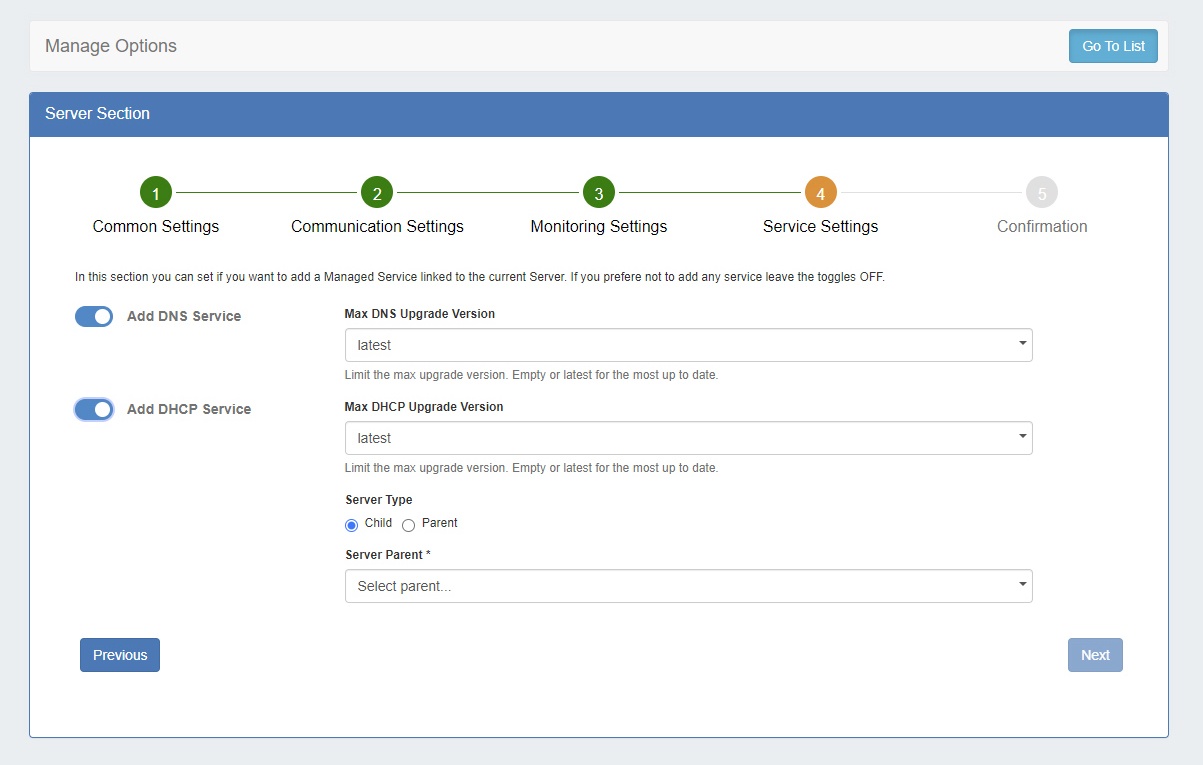
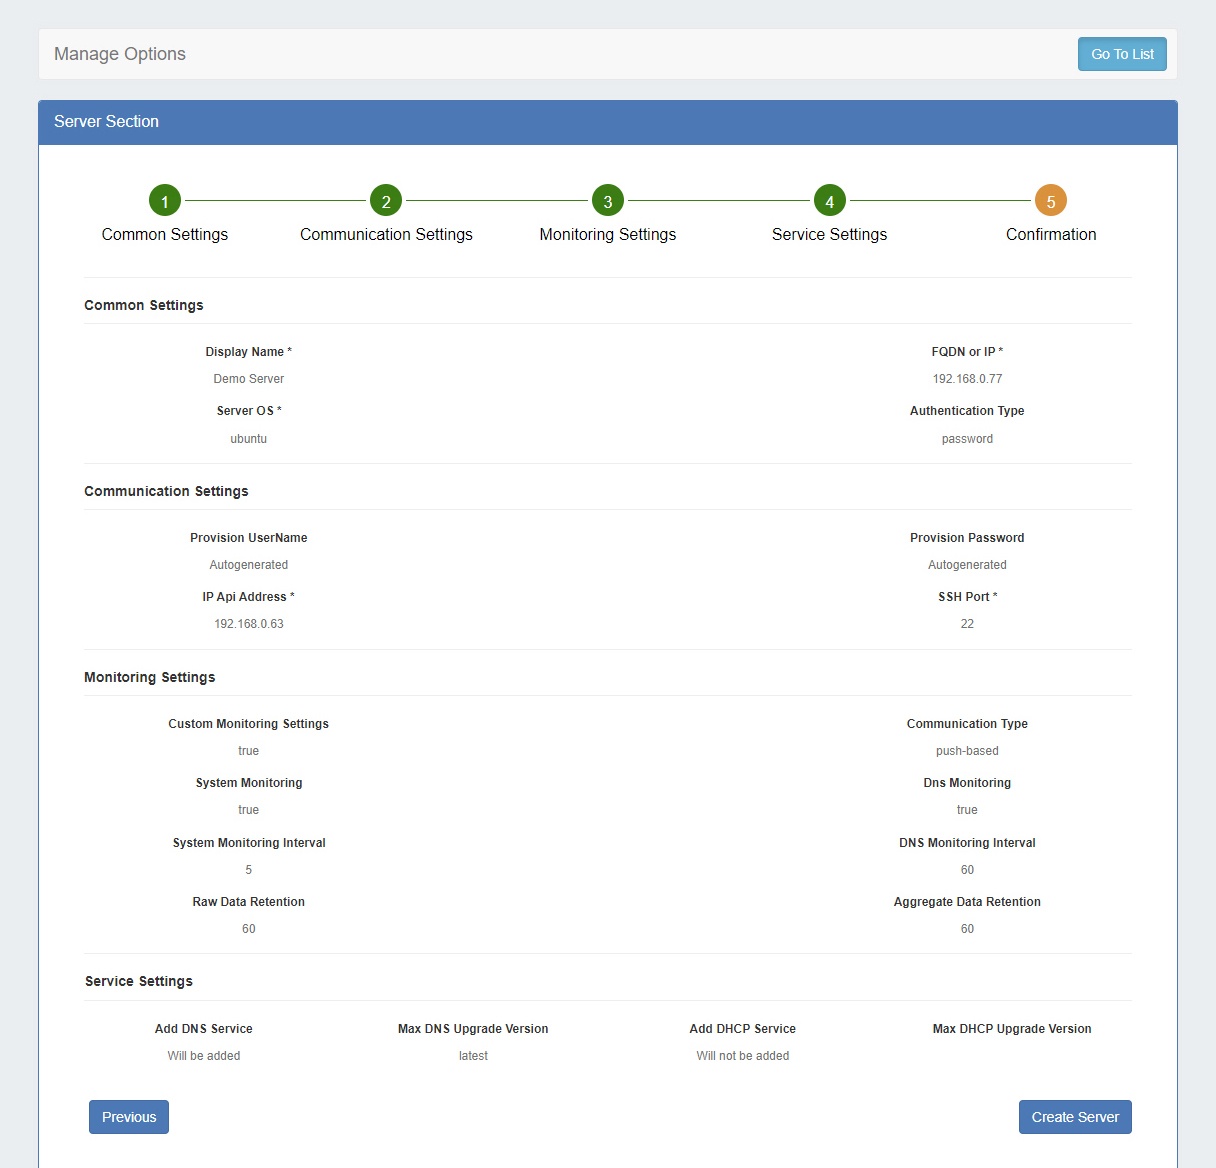
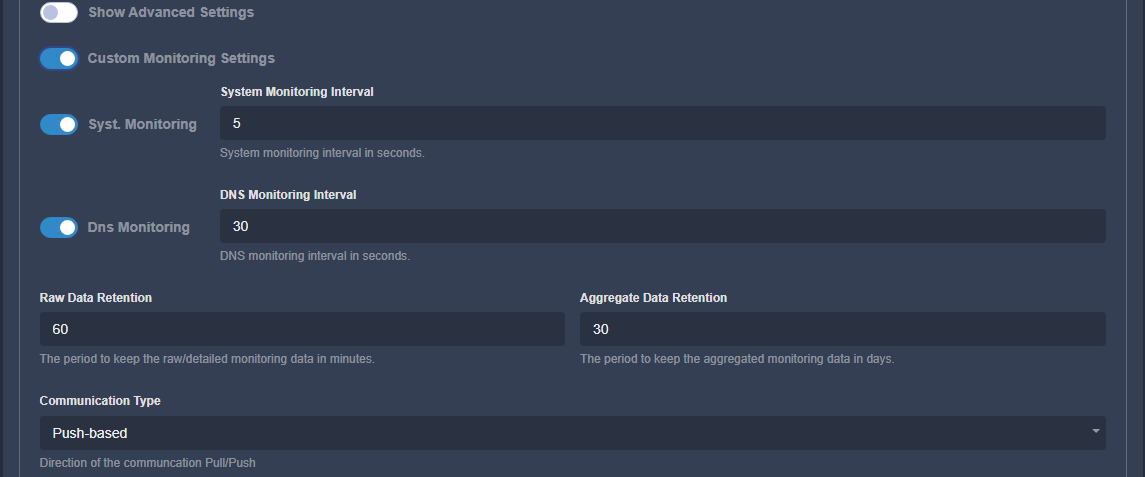
From there, proceed through each of the five steps of the Add New Server wizard, below:
After a new server has been created, you may edit it by clicking on the server name, or view monitoring data from the Managed Server list.
View or Edit Managed Server Details
Click on a server name, or open the server action menu to view details for a managed server.
The details of a server are organized into tabs: Settings, Services, Monitoring, and RPS.
Settings
By default, only "Display Name", "Server OS" and "FQDN or IP" fields are shown.
Services
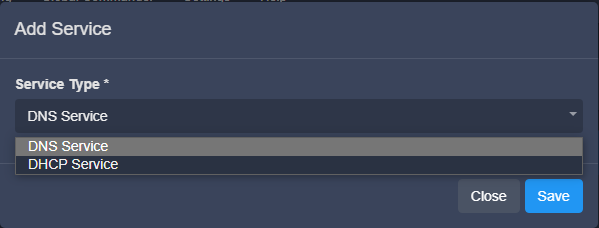
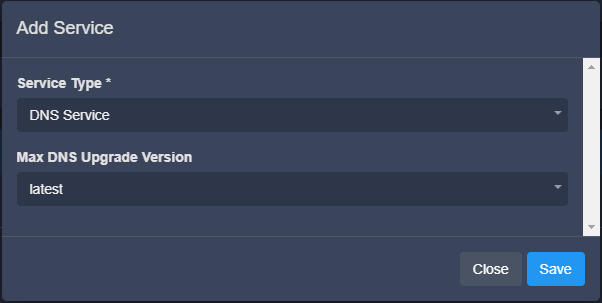
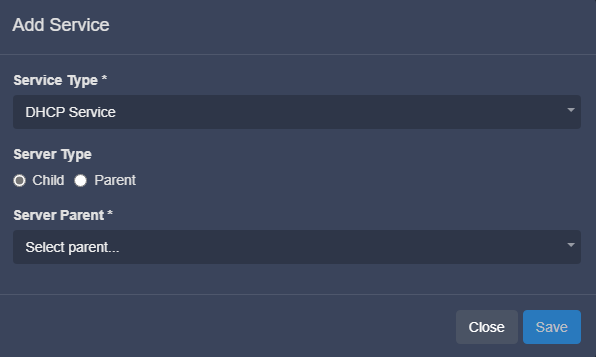
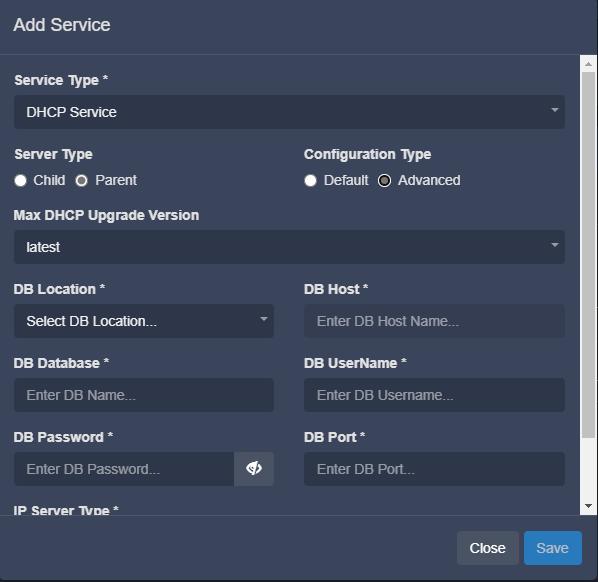
Under Services, you can view the enabled components for this server.
Monitoring
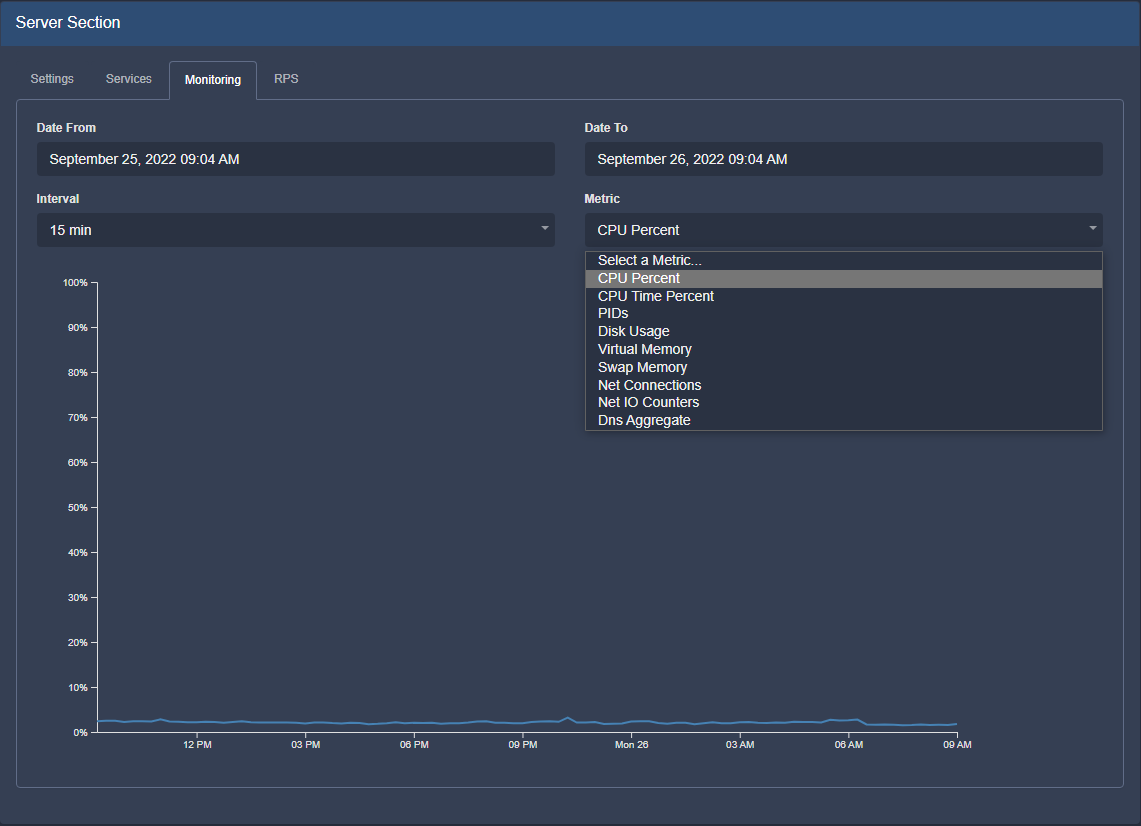
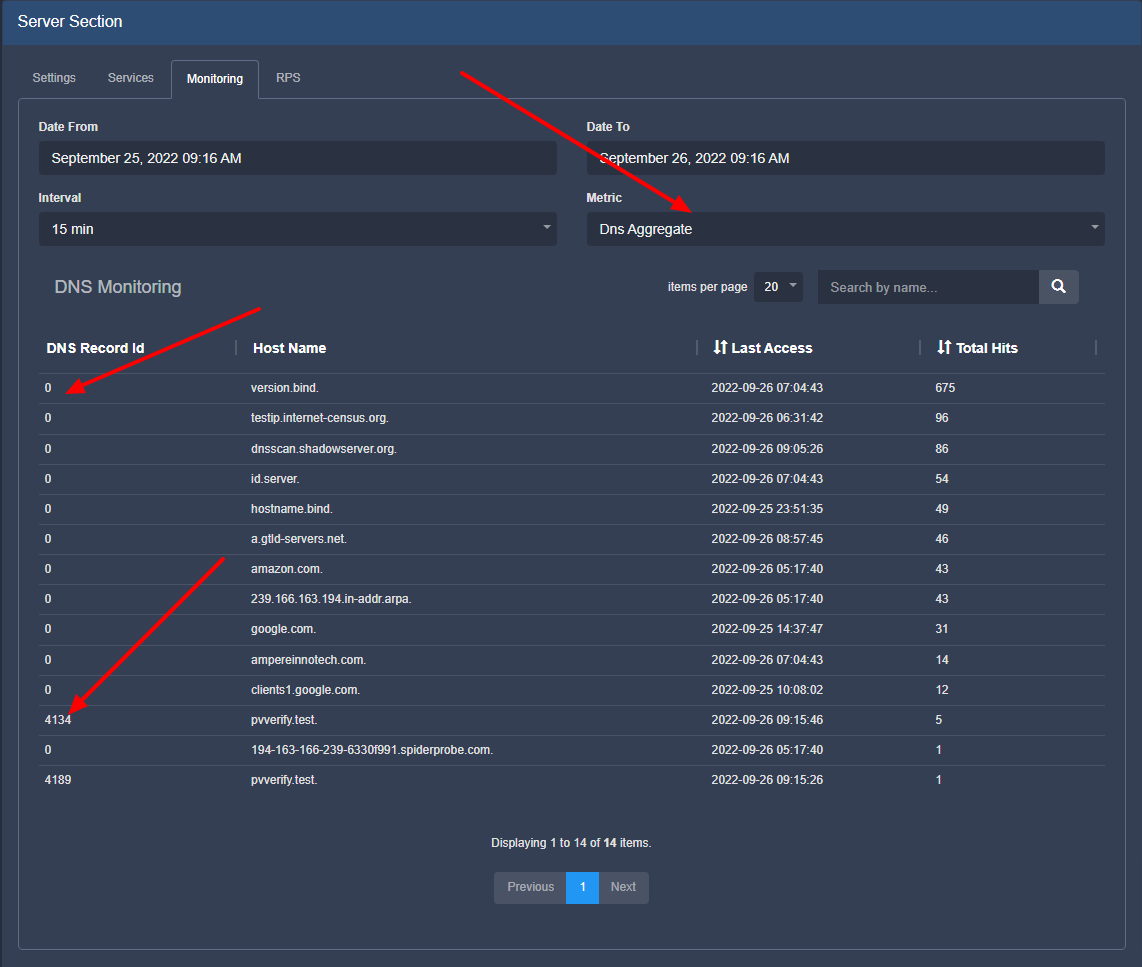
Under Monitoring, you can see the aggregated system statistics + "DNS aggregate":
RPS (requests per second)
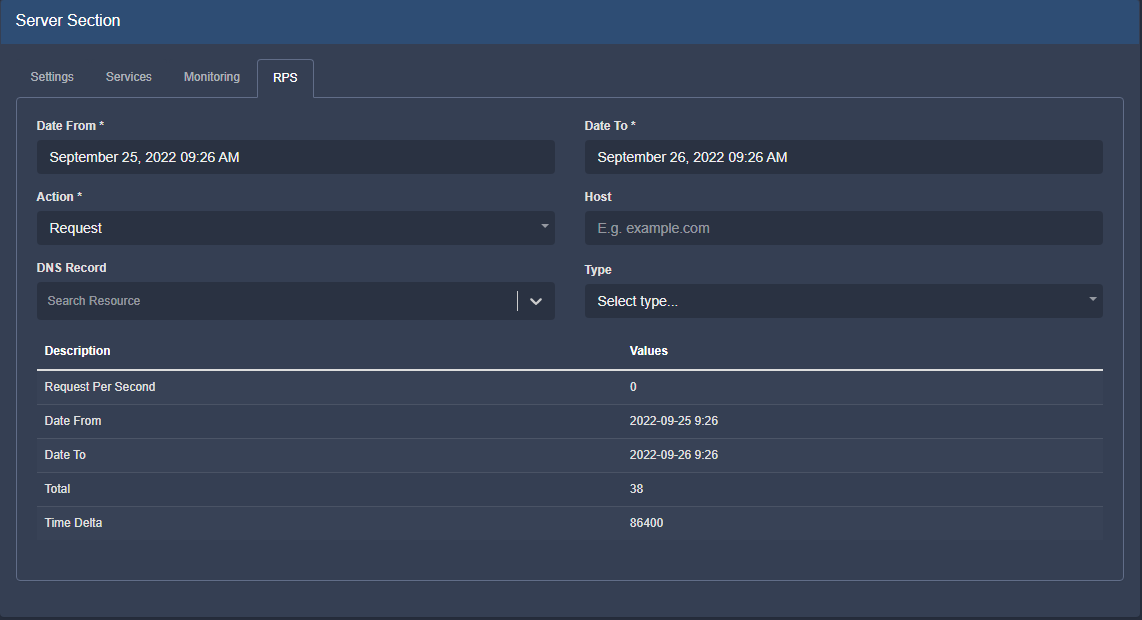
Under RPS, you can search for data for a given dns record.
Update / Install Managed Server (Existing Component)
The installation can be run more than once. If we already have running components, they will be stopped before the real installation continues.
If there is newer version of any component, it will be downloaded and used.
The overall process is:
Requirements
Python 3.6+ and Docker are the only requirements. If we run the installation with root (see below) and we have internet access, the installation process will install Docker.
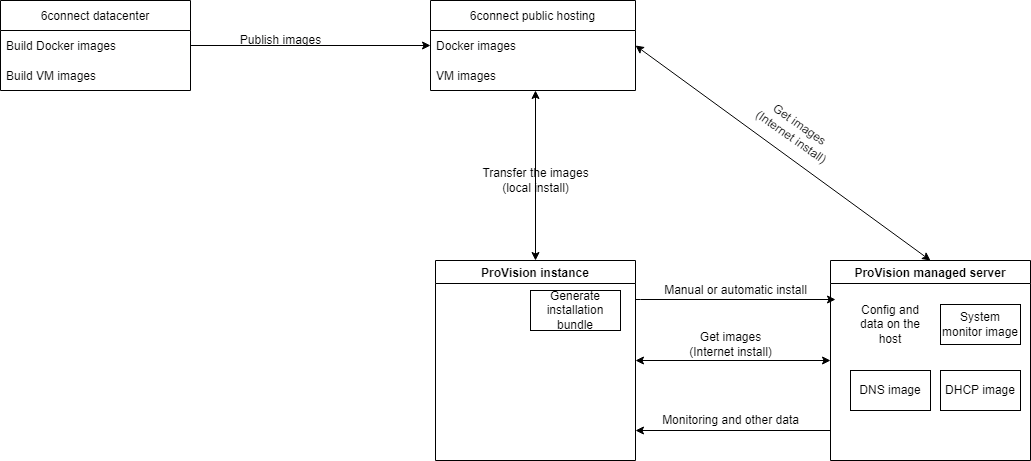
The overall process is always the same - ProVision generates an install bundle, it is transferred to the server, extracted there and run some scripts from it. This can be done by ProVision (automatic install) or by the user (manual). In case of automatic install ProVision will automate the steps, which the user would do manually. All the components can run without root access, but we need it for user creation, folders creation, network and heartbeat service setup.
Automatic (Recommended)
This is the recommended and easiest setup method. If you have root access, ProVision can do all the necessary actions.
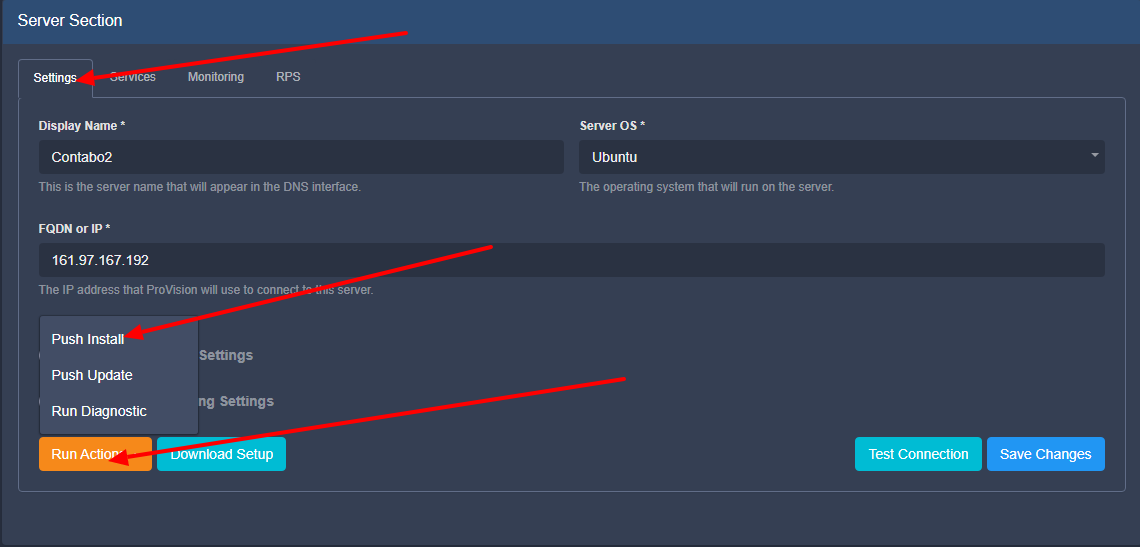
Go to the details page → Settings tab → "Run Actions" → "Push Install"
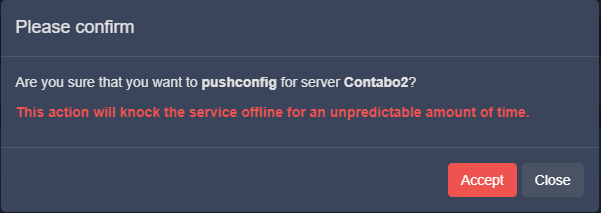
Confirmation dialog will be shown:
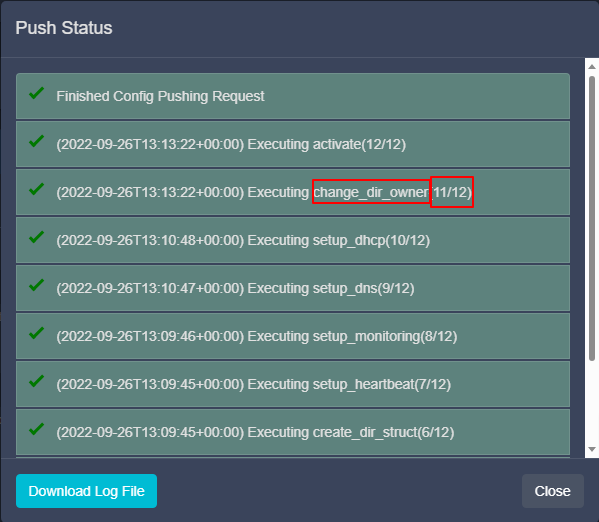
Popup with the progress will be shown.:
Each command/step is shown together with the overall progress. The different steps take different time to complete, meaning 6/12 doesn't mean half of the time remains. The required time depends on the internet connection speed and CPU mainly. The longest steps are "setup_monitoring" and "setup_dhcp", they have to download the biggest containers.
Manual (from the command line)
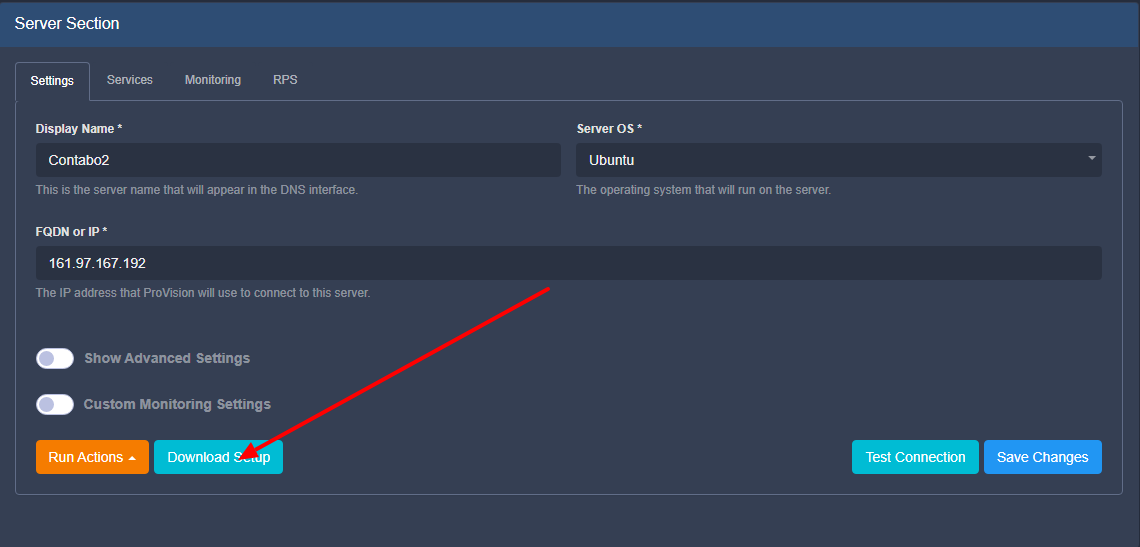
This case is usually when the user doesn't want to input the root user in ProVision, but he has root access. The setup bundle should be downloaded and saved on your local computer:
The setup bundle name will be in format "setup-XXX.tar" where XXX is the resource ID of the managed server. The rest of the process is:
- copy the file to the managed server (with SCP or any other suitable way)
- extract it with "tar -xf setup-XXX.tar"
- execute "sudo /bin/bash install_python3.sh" - this should finish with "PVOK"
Without root
This is the used if root access to the server is not available. In this case, an admin with root access should first do the following:
Install docker with the relevant commands for the OS. This can be done by running "install_docker.sh" from the setup bundle with root or any other suitable way
Install docker CentOS
Install docker UbuntuCreate the relevant user, add it to "docker" group, create "/provision" directory and make the created user owner of this directory.
User and directory setupMake the necessary network changes. This can be done by running "network_config.sh" from the install bundle
Network config CentOSNetwork config Ubuntu
Create service file and edit ﹤user﹥ with the correct system user.
pv_heartbeat.serviceMake symlink to this file (replace /provision/libs/pv_heartbeat.service with the correct file path):
Create sudoers file (﹤user﹥ with the correct system user) and place it in /etc/sudoers.d:
pv_heartbeat symlink
CentOS sudoers
Ubuntu sudoersReload the systemct daemon:
Reload services
From this point automatic or manual setup can be done with the non-root user
Update Managed Server
Updates may be automatic or manually performed.
Automatic:
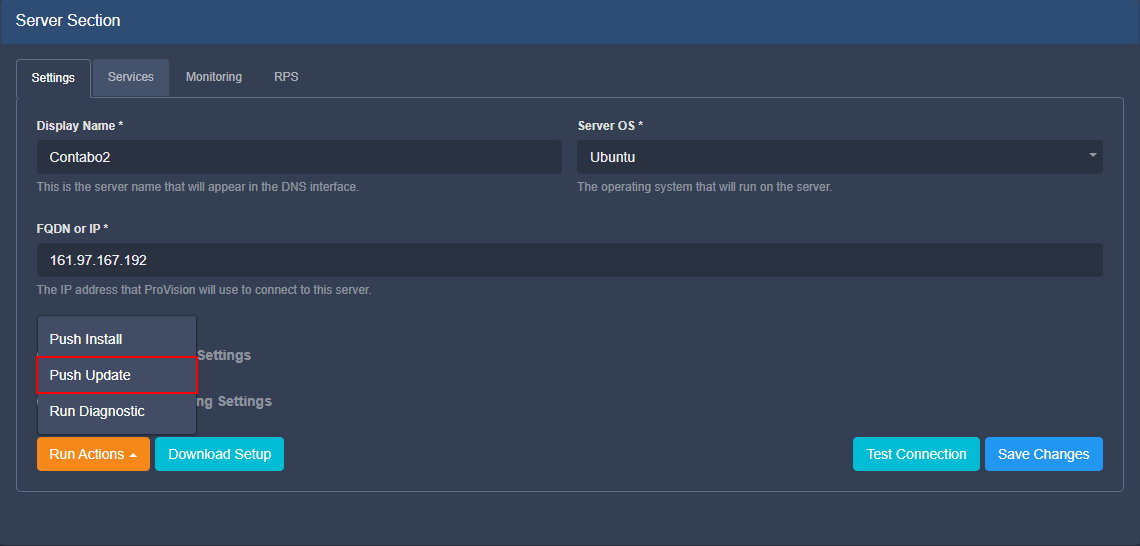
In ProVision's Managed Servers page, open the server details. Then, under the settings tab, click "Run Actions, and select "Push Update".
From the command line on the server, execute "python3 /provision/libs/pv_update.py"
The process of update of a component is as follow:
- Stop the running instance
- Check for newer version and download, if any exist. If no newer version is available, start the component again and skip the other steps
- Install the newer version
- Verify the component - if the container is running and if the component is working as expected. For DNS we have internal TXT DNS record "pvverify.test" with value "PVOK". We check if it is resolved correctly. For DHCP we have internal pool for 198.51.100.0/24 and we try to acquire IP from it.
- In case of failure in the verification, start the last stable version (the one which was stopped)
Managed Server Diagnostics / Debug
Automatic - GUI
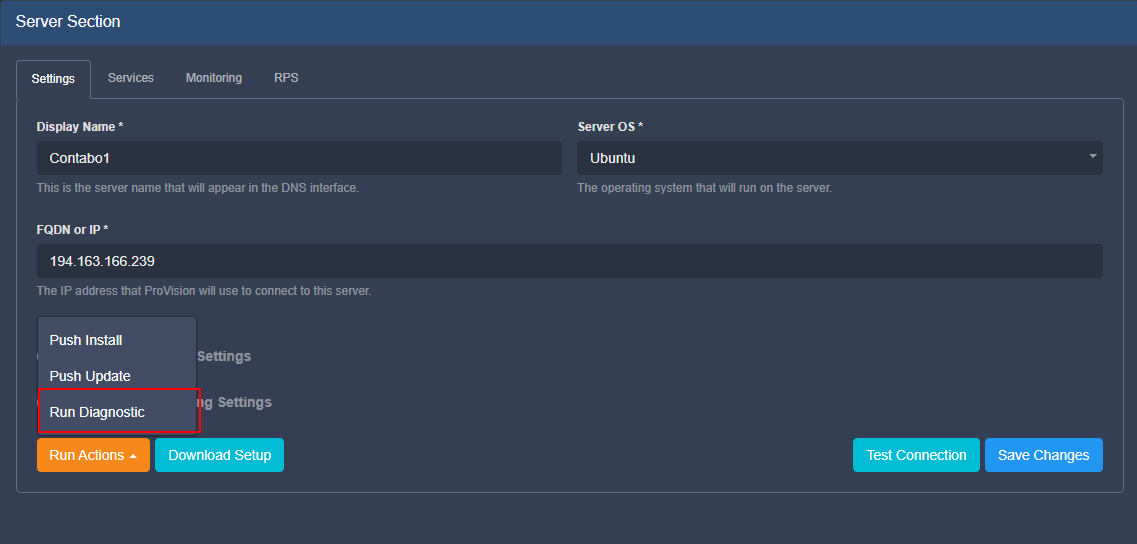
The user can run some basic diagnostics from the Managed Serve details page, under the Settings tab. Click "Run Actions", then "Run Diagnostics":
All the debug and diagnostic tools are in the monitoring component, thus it needs to be running in order to function.
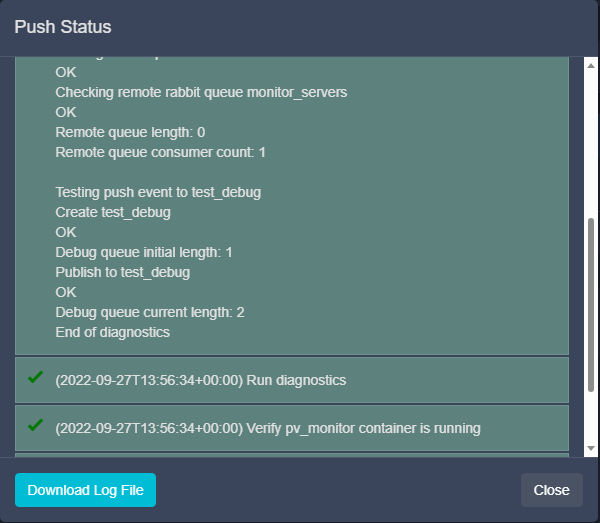
After clicking the button, a confirmation dialog will be shown with the results:
We verify if we have docker running, if the monitoring component is running and the RabbitMQ connection.
You may download the results by clicking "Download Log File", and "Close" when done.
Manual - Command Line Scripts
All the scripts are in "/provision/libs/".
All the scripts can be started with "-h" parameter to show relevant help.
- pv_install.py - used for the whole setup. The process itself is broken into separate steps, which can be executed individually with "-e/--exec-only=". The steps can be seen from the help (-h). This should be used by developers and for debugging purposes
- start_pv_*.sh - all these scripts are used to start given component. All of them support "-v/–version" to specify the version of the component to start and "-b/–bash" to start the container in debug mode. In debug mode the user will be logged into the container but without starting /start.sh (the entrypoint).
- stop_pv_*.sh - all these scripts are used to properly stop given component/container
Local
In addition to logging into any of the containers (starting the relevant script with -b/–bash) few other files are included into the monitoring component:
- mysql client for browsing the database
- dhtest (link) for DHCP testing
- dnsutils - dig, nslookup, nsupdate
- telnet
Delete Managed Server
To delete a managed server, right click on the action menu/ row for the server, and select "Delete".
