Managed Servers

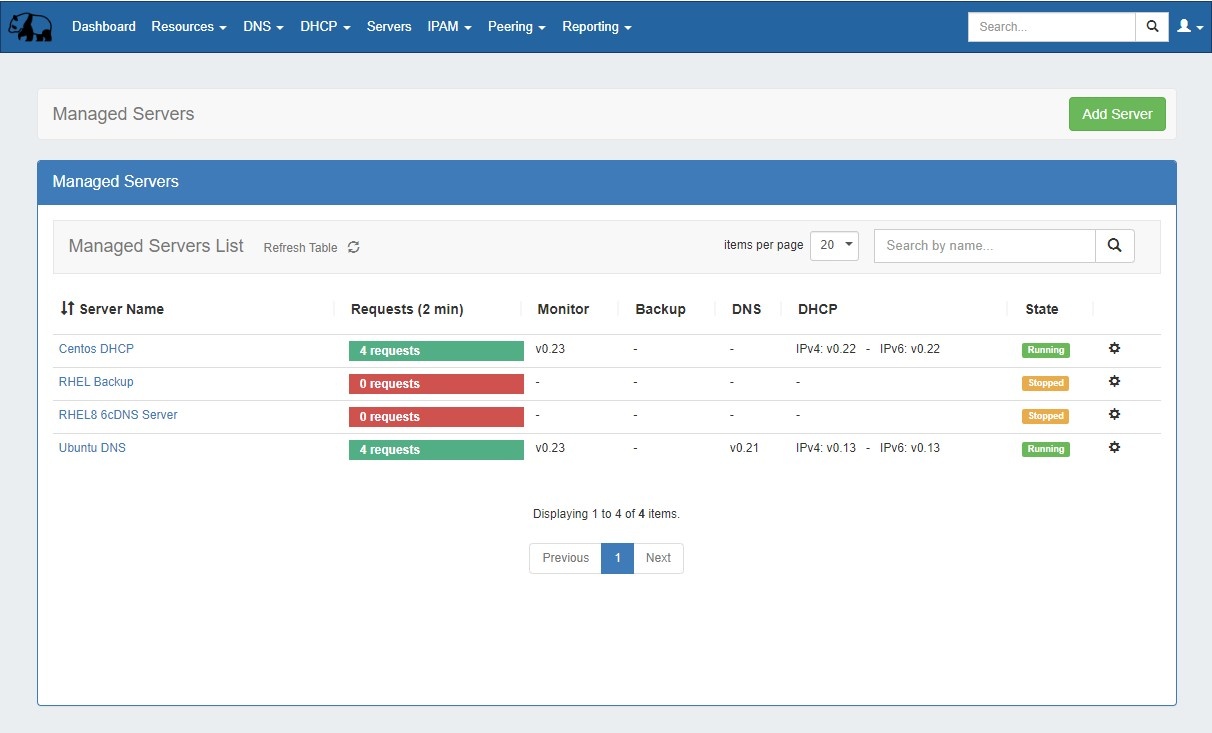
The Managed Servers tab allows for DNS, DHCP, and DHCP Backup VM servers to be created, installed, managed, and monitored from within ProVision.
...
ProVision's Managed Servers tab allows for DNS (Knot-based) and , DHCP(Kea-based), and Backup VMs to be created, managed and monitored from within ProVision, either from the GUI or command line.
...
- DNS Monitoring includes hit count for given period for each host/resource, total hit count, and last access time
- System monitoring Includes CPU load, Disk usage, connection information, swap memory, and virtual memory monitoring.
- Monitoring is available via GUI or API.
- Both "Push" and "Pull" options for statistics data are available
- Heartbeat service independent of Docker to provide monitoring data
Permissions
Managed Servers uses a "6c servers" user group, under which automatic or manual "server users" are created. The "6c servers" user group gives permissions to all 6c server resources.
Managed Backup Features include:
- Dedicated database and web server.
- Requests and stores the backups.
- Verifies backups - checks for file corruption, data integrity, encryption/keys.
- Backups are encrypted and the backup server itself doesn't have the password/key to decrypt them.
- Customizable retention settings.
- Monitors its own disk space.
- Separate access management/users.
Permissions
Managed Servers uses a "6c servers" user group, under which automatic or manual "server users" are created. The "6c servers" user group gives permissions to all 6c server resources.
The The "server users" are necessary to allow access and permissions for the managed server(s). When new server is created with an empty user (instead of a user-provided existing user) a random new user is automatically created under that group. Only that server user has permission to update the associated managed server.
...
The "Managed Servers" sub-tab under Admin Settings includes modules for global setup of Monitoring Settings, Update Settings, Monitoring Services, and RabbitMQ settings, and Managed Backups Settings.
These settings provide the "default" values for servers created from the Managed Servers Tab.

After making any settings updates, be sure to click "Save Changes" under the updated module.
...
| Expand | ||
|---|---|---|
| ||
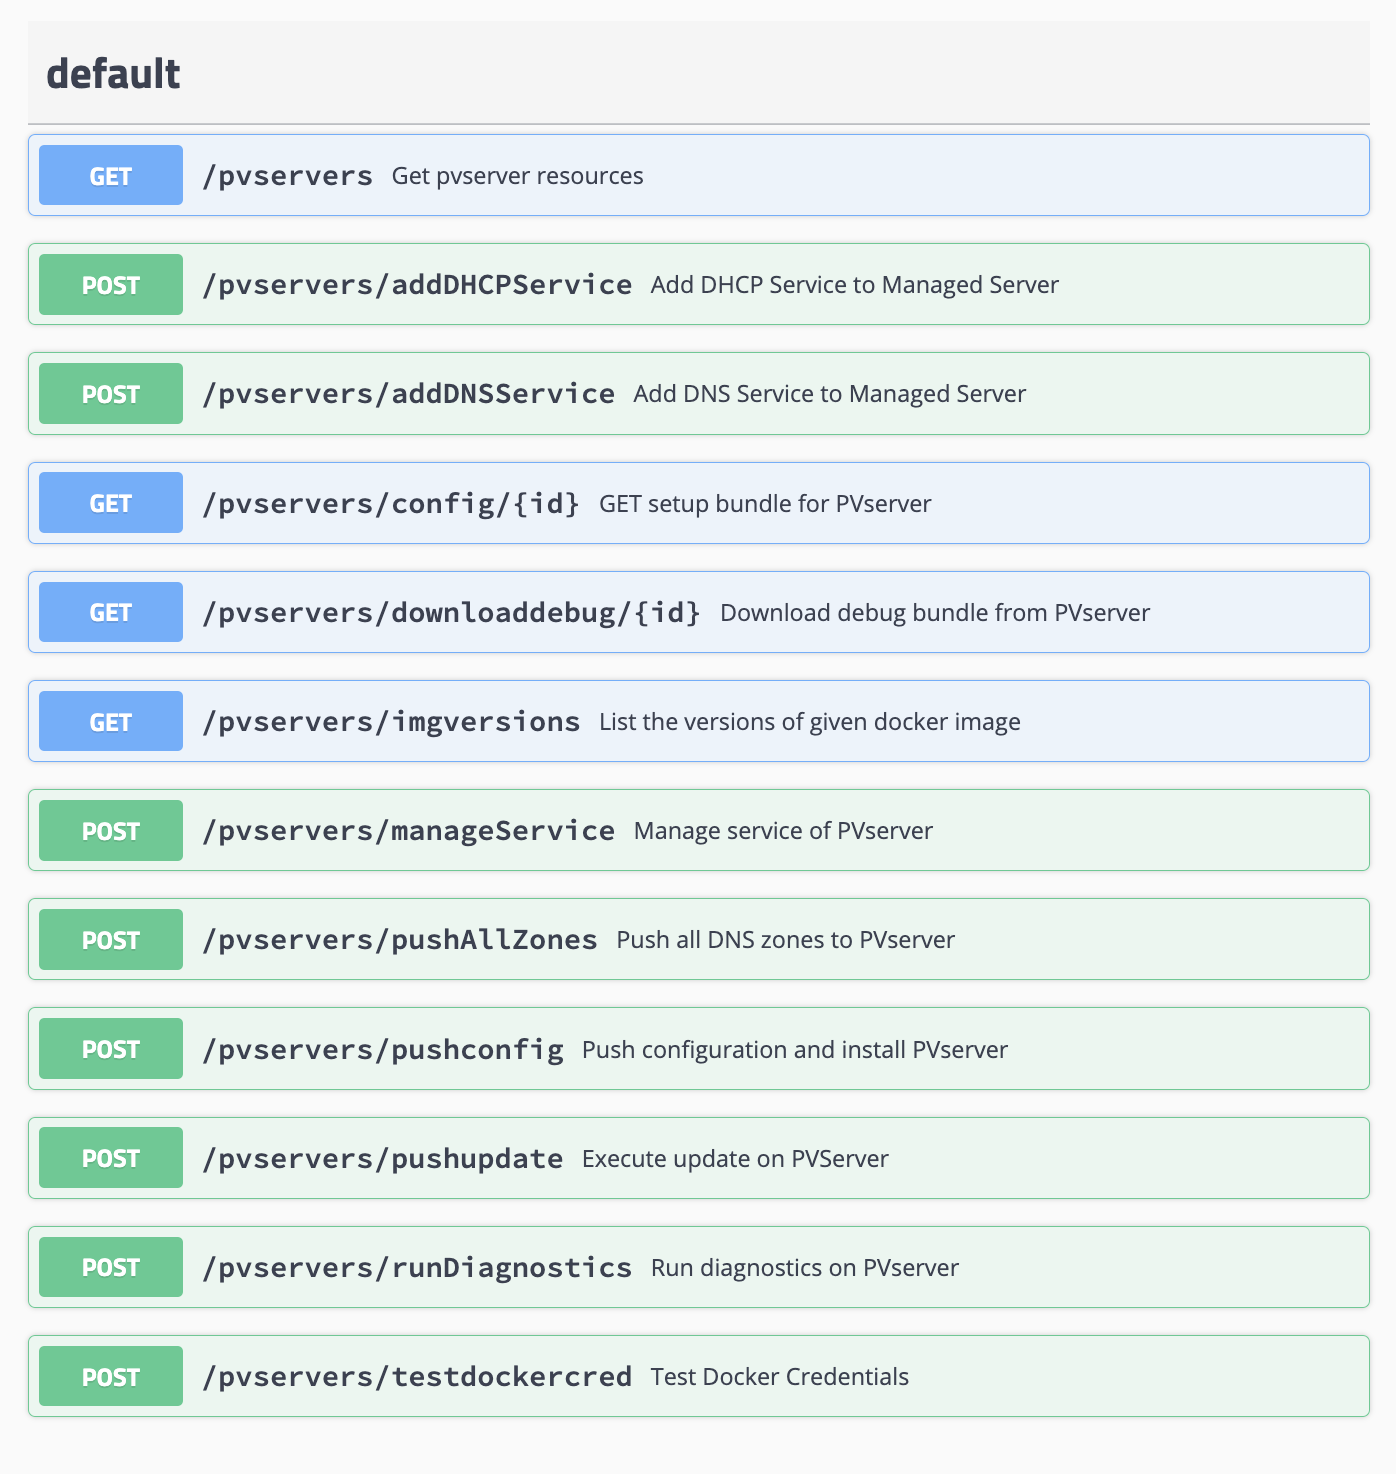
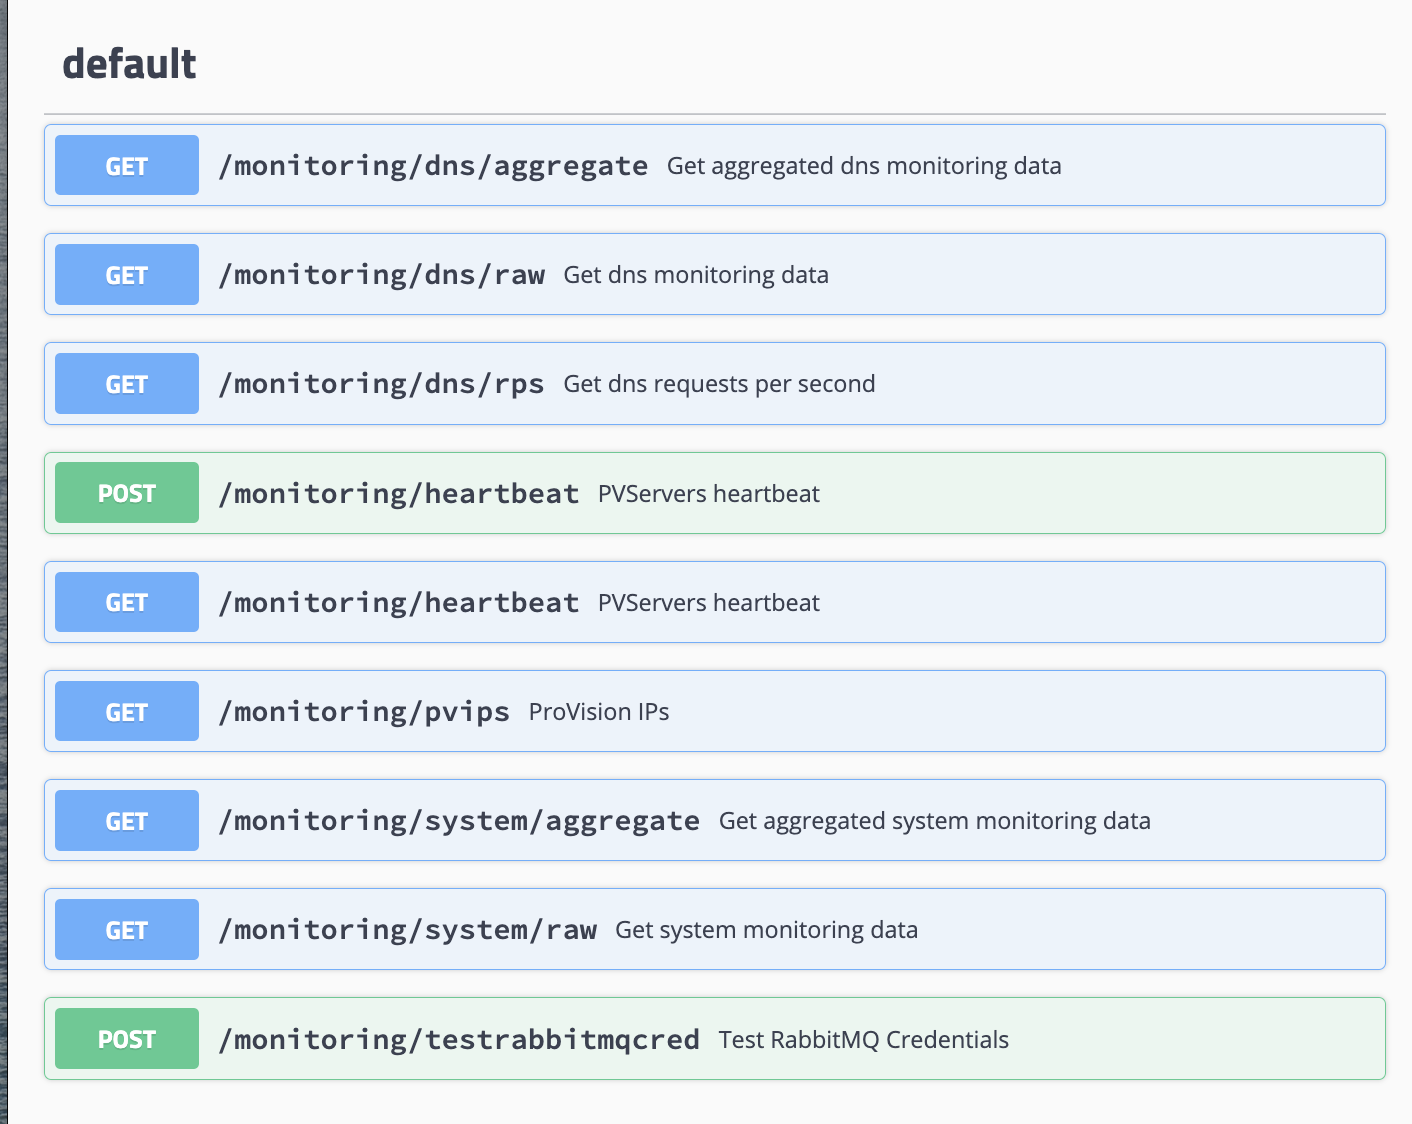
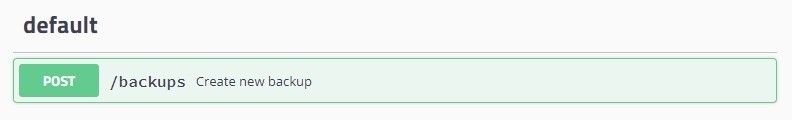
Managed Servers Endpoints:
|
Managed Servers Flow Chart
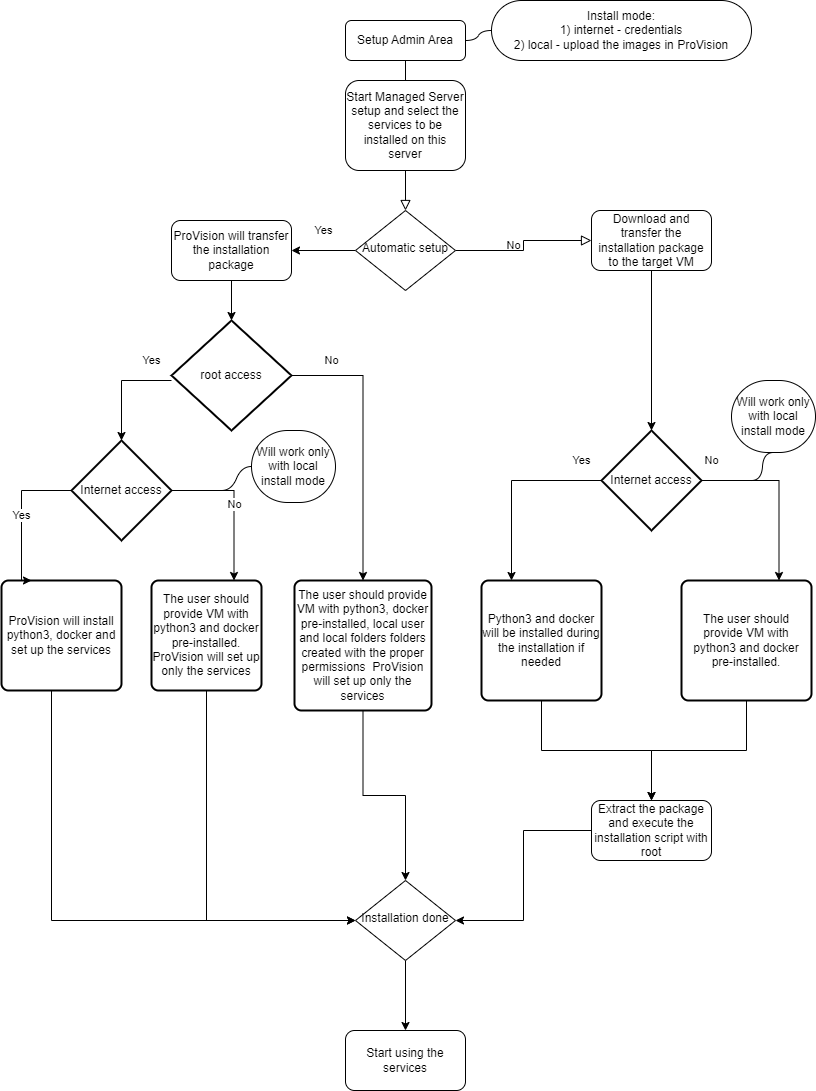
Managed Servers - Initial Setup and Installation
...
In ProVision, navigate to Admin Settings → Managed Servers and enter or verify settings in the following areas:
1) RabbitMQ Settings
Enter the RabbitMQ IP, port, username, and password into the RabbitMQ Settings section. To verify the settings, click "Test Credentials".
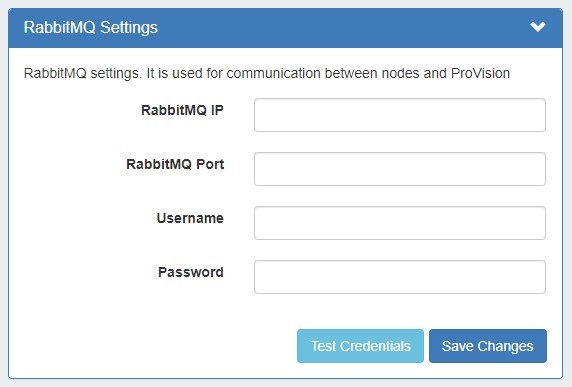
When done, click "Save Changes".
...
and enter or verify settings in the following areas:
1) Enter Monitoring Settings
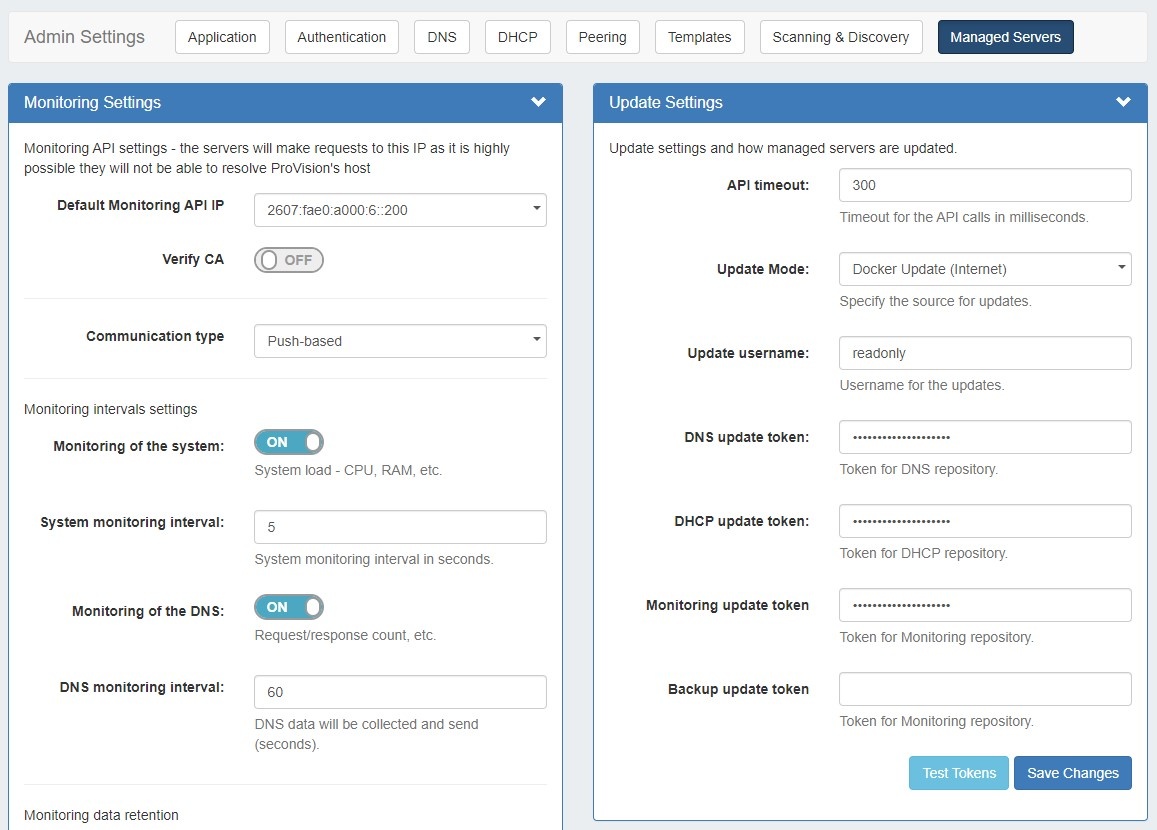
Under Monitoring Settings, select the "Default Monitoring API IP", and enter any additional setting options as follows:
...
- Default Monitoring API IP: The default IP to be used for API calls (heartbeat, activation, etc.) for managed server monitoring and to send API requests, as multiple IPs may be available depending on the Provision set up.
- Note: The Default Monitoring API IP can be set to a default value in this area, but it may also be set individually per managed server as an override.
- Verify CA: Toggle to "on" if you wish to enable the CA check.
- Communication type: Push (when the server pushes data to ProVision) and pull (when ProVision connects to the server and pulls the data). Push is preferred, but Pull-based may be desirable in cases where a firewall would not allow inbound connections to ProVision.
- Monitoring of the system: Toggle to "on" to enable monitoring of system statistics.
- System monitoring interval: How often (in seconds) the system will be checked. The smaller the interval, the more data there will be to store.
- Monitoring of the DNS: Toggle to "on" to enable gathering statistics from the DNS server.
- DNS monitoring interval: How often (in seconds) the DNS server will be monitored. Data will be aggregated for the set period of time and the aggregated results will be sent.
- Raw data retention: The number of minutes to retain raw data. By default, this is set to 1440 minutes (1 day). Raw data requires sizable storage needs.
- Aggregated data retention: The number of days to retain aggregated data.
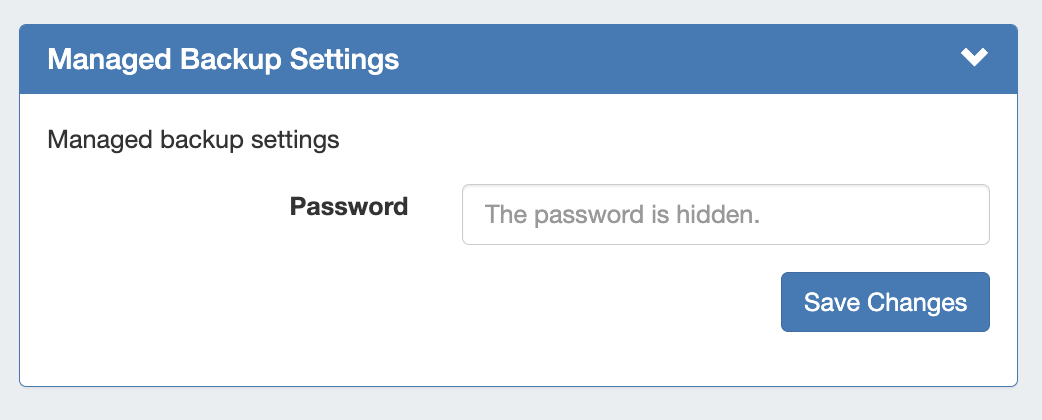
2) Enter Managed Backup Settings
If in use, enter the password for Managed Backup Servers and click "save changes".
3) Enter Update Settings
Enter Update settings to use for Managed Servers, starting with API timeout (in milliseconds) and Update Mode.
...
| Expand | ||||
|---|---|---|---|---|
| ||||
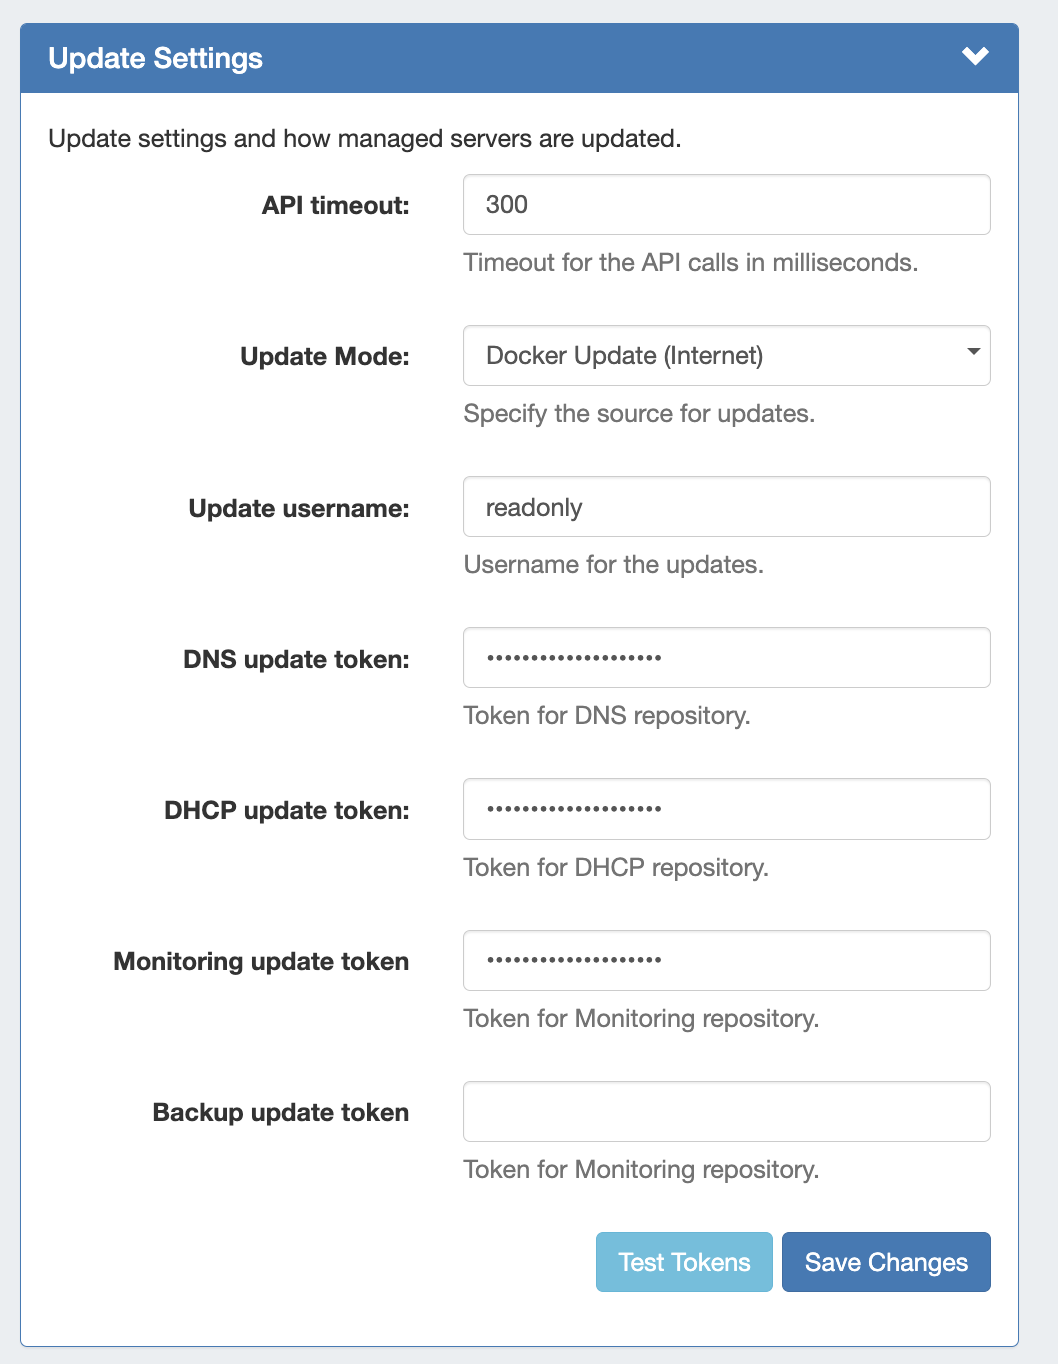
Update Settings - Docker Update Mode (Internet)
API timeout: Timeout for API calls in milliseconds. Update Mode: Enter the source for updates, depending on internet accessibility. Two options are available:
|

...
| Expand | ||
|---|---|---|
| ||
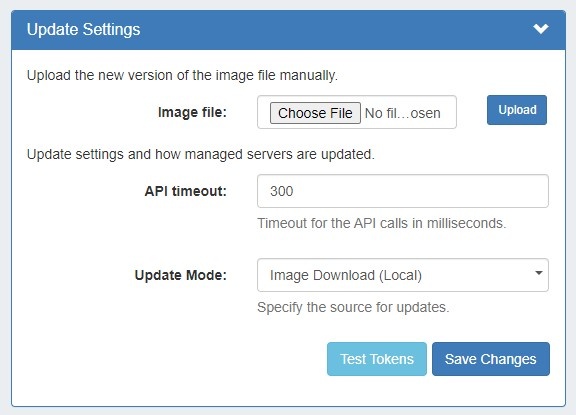
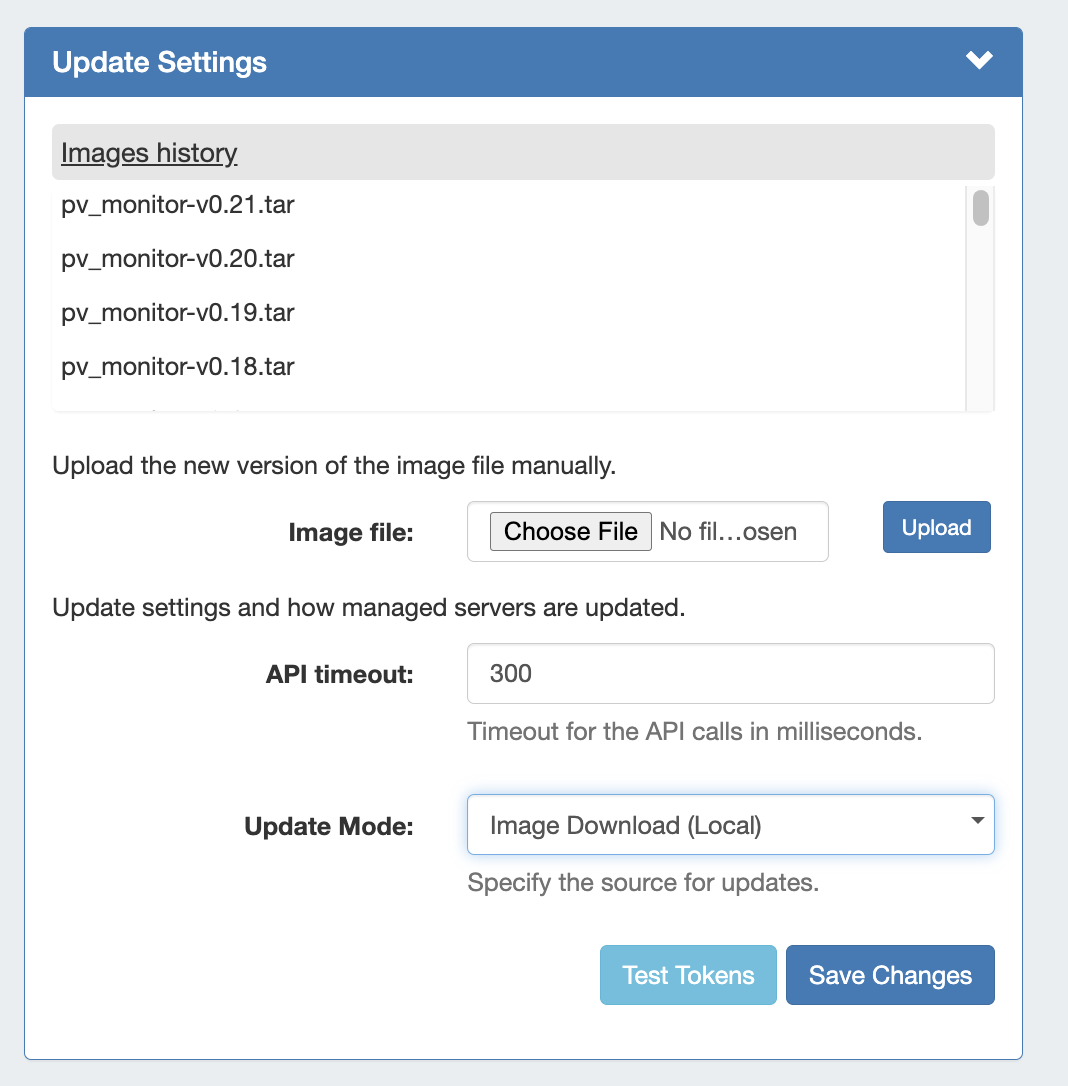
Update Settings - Image Download (Local)If Update Mode is set to "Image Download (Local)", the following settings will display to enter:
Image file: Attach the Image file for upload to ProVision.
API timeout: Timeout for API calls in milliseconds. Update Mode: Enter the source for updates - Image Download (Local), or opt to change to Docker Update (Requires Internet). Images history: Available only after saving changes. Once a history is available, it will display at the top of the module.
Test Tokens: Click to test the applied tokens for DNS, DHCP, and Monitor. |
4) RabbitMQ Settings
Enter the RabbitMQ IP, port, username, and password into the RabbitMQ Settings section. To verify the settings, click "Test Credentials".
When done, click "Save Changes".
Install Python 3 / Additional Services
...